Home Depot 2012 Annual Report Download - page 54
Download and view the complete annual report
Please find page 54 of the 2012 Home Depot annual report below. You can navigate through the pages in the report by either clicking on the pages listed below, or by using the keyword search tool below to find specific information within the annual report.-
 1
1 -
2
-
3
-
4
-
5
-
6
-
7
-
8
-
9
-
10
-
11
-
12
-
13
-
14
-
15
-
16
-
17
-
18
-
19
-
20
-
21
-
22
-
23
-
24
-
25
-
26
-
27
-
28
-
29
-
30
-
31
-
32
-
33
-
34
-
35
-
36
-
37
-
38
-
39
-
40
-
41
-
42
-
43
-
 44
44 -
 45
45 -
 46
46 -
 47
47 -
 48
48 -
 49
49 -
 50
50 -
 51
51 -
 52
52 -
 53
53 -
 54
54 -
 55
55 -
 56
56 -
 57
57 -
 58
58 -
 59
59 -
 60
60 -
 61
61 -
 62
62 -
 63
63 -
 64
64 -
65
-
66
-
67
-
68
 |
 |

48
of restricted stock and performance shares vesting during fiscal 2012, 2011 and 2010 was $265 million, $290 million and
$168 million, respectively.
9. EMPLOYEE BENEFIT PLANS
The Company maintains active defined contribution retirement plans for its employees (the "Benefit Plans"). All associates
satisfying certain service requirements are eligible to participate in the Benefit Plans. The Company makes cash contributions
each payroll period up to specified percentages of associates’ contributions as approved by the Board of Directors.
The Company also maintains a restoration plan to provide certain associates deferred compensation that they would have
received under the Benefit Plans as a matching contribution if not for the maximum compensation limits under the Internal
Revenue Code. The Company funds the restoration plan through contributions made to a grantor trust, which are then used to
purchase shares of the Company’s common stock in the open market.
The Company’s contributions to the Benefit Plans and the restoration plan were $182 million, $171 million and $171 million
for fiscal 2012, 2011 and 2010, respectively. At February 3, 2013, the Benefit Plans and the restoration plan held a total of 12
million shares of the Company’s common stock in trust for plan participants.
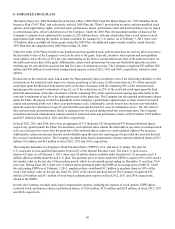
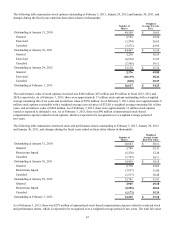
10. BASIC AND DILUTED WEIGHTED AVERAGE COMMON SHARES
The reconciliation of basic to diluted weighted average common shares for fiscal 2012, 2011 and 2010 was as follows
(amounts in millions):
Fiscal Year Ended
February 3,
2013 January 29,
2012 January 30,
2011
Weighted average common shares 1,499 1,562 1,648
Effect of potentially dilutive securities:
Stock Plans 12 8 10
Diluted weighted average common shares 1,511 1,570 1,658
Stock plans consist of shares granted under the Company’s employee stock plans as described in Note 8 to the Consolidated
Financial Statements. Options to purchase 1 million, 23 million and 39 million shares of common stock at February 3,
2013, January 29, 2012 and January 30, 2011, respectively, were excluded from the computation of Diluted Earnings per
Share because their effect would have been anti-dilutive.
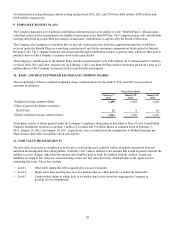
11. FAIR VALUE MEASUREMENTS
The fair value of an asset is considered to be the price at which the asset could be sold in an orderly transaction between
unrelated knowledgeable and willing parties. A liability’s fair value is defined as the amount that would be paid to transfer the
liability to a new obligor, rather than the amount that would be paid to settle the liability with the creditor. Assets and
liabilities recorded at fair value are measured using a three-tier fair value hierarchy, which prioritizes the inputs used in
measuring fair value. These tiers include:
• Level 1 – Observable inputs that reflect quoted prices in active markets
• Level 2 – Inputs other than quoted prices in active markets that are either directly or indirectly observable
• Level 3 – Unobservable inputs in which little or no market data exists, therefore requiring the Company to
develop its own assumptions