Home Depot 2012 Annual Report Download - page 37
Download and view the complete annual report
Please find page 37 of the 2012 Home Depot annual report below. You can navigate through the pages in the report by either clicking on the pages listed below, or by using the keyword search tool below to find specific information within the annual report.-
 1
1 -
2
-
3
-
4
-
5
-
6
-
7
-
8
-
9
-
10
-
11
-
12
-
13
-
14
-
15
-
16
-
17
-
18
-
19
-
20
-
21
-
22
-
23
-
24
-
25
-
26
-
 27
27 -
 28
28 -
 29
29 -
 30
30 -
 31
31 -
 32
32 -
 33
33 -
 34
34 -
 35
35 -
 36
36 -
 37
37 -
 38
38 -
 39
39 -
 40
40 -
 41
41 -
 42
42 -
 43
43 -
 44
44 -
 45
45 -
 46
46 -
 47
47 -
48
-
49
-
50
-
51
-
52
-
53
-
54
-
55
-
56
-
57
-
58
-
59
-
60
-
61
-
62
-
63
-
64
-
65
-
66
-
67
-
68
 |
 |

31
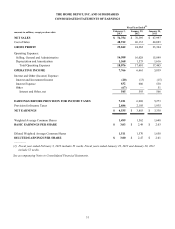
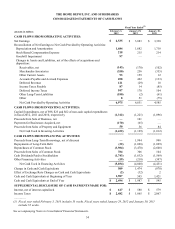
THE HOME DEPOT, INC. AND SUBSIDIARIES
CONSOLIDATED STATEMENTS OF EARNINGS
Fiscal Year Ended(1)
amounts in millions, except per share data February 3,
2013 January 29,
2012 January 30,
2011
NET SALES $ 74,754 $ 70,395 $ 67,997
Cost of Sales 48,912 46,133 44,693
GROSS PROFIT 25,842 24,262 23,304
Operating Expenses:
Selling, General and Administrative 16,508 16,028 15,849
Depreciation and Amortization 1,568 1,573 1,616
Total Operating Expenses 18,076 17,601 17,465
OPERATING INCOME 7,766 6,661 5,839
Interest and Other (Income) Expense:
Interest and Investment Income (20)(13)(15)
Interest Expense 632 606 530
Other (67)— 51
Interest and Other, net 545 593 566
EARNINGS BEFORE PROVISION FOR INCOME TAXES 7,221 6,068 5,273
Provision for Income Taxes 2,686 2,185 1,935
NET EARNINGS $ 4,535 $ 3,883 $ 3,338
Weighted Average Common Shares 1,499 1,562 1,648
BASIC EARNINGS PER SHARE $ 3.03 $ 2.49 $ 2.03
Diluted Weighted Average Common Shares 1,511 1,570 1,658
DILUTED EARNINGS PER SHARE $ 3.00 $ 2.47 $ 2.01
—————
(1) Fiscal year ended February 3, 2013 includes 53 weeks. Fiscal years ended January 29, 2012 and January 30, 2011
include 52 weeks.
See accompanying Notes to Consolidated Financial Statements.