Home Depot 2012 Annual Report Download - page 53
Download and view the complete annual report
Please find page 53 of the 2012 Home Depot annual report below. You can navigate through the pages in the report by either clicking on the pages listed below, or by using the keyword search tool below to find specific information within the annual report.-
 1
1 -
2
-
3
-
4
-
5
-
6
-
7
-
8
-
9
-
10
-
11
-
12
-
13
-
14
-
15
-
16
-
17
-
18
-
19
-
20
-
21
-
22
-
23
-
24
-
25
-
26
-
27
-
28
-
29
-
30
-
31
-
32
-
33
-
34
-
35
-
36
-
37
-
38
-
39
-
40
-
41
-
42
-
 43
43 -
 44
44 -
 45
45 -
 46
46 -
 47
47 -
 48
48 -
 49
49 -
 50
50 -
 51
51 -
 52
52 -
 53
53 -
 54
54 -
 55
55 -
 56
56 -
 57
57 -
 58
58 -
 59
59 -
 60
60 -
 61
61 -
 62
62 -
 63
63 -
64
-
65
-
66
-
67
-
68
 |
 |

47
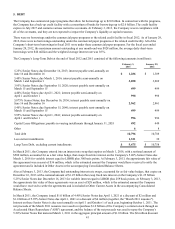
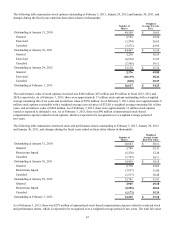
The following table summarizes stock options outstanding at February 3, 2013, January 29, 2012 and January 30, 2011, and
changes during the fiscal years ended on these dates (shares in thousands):
Number of
Shares
Weighted
Average Exercise
Price
Outstanding at January 31, 2010 49,309 $ 36.81
Granted 3,723 32.24
Exercised (1,294) 26.63
Canceled (7,271) 43.95
Outstanding at January 30, 2011 44,467 $ 35.56
Granted 3,236 36.55
Exercised (6,938) 33.25
Canceled (7,595) 39.11
Outstanding at January 29, 2012 33,170 $ 35.32
Granted 2,376 49.89
Exercised (18,119) 38.24
Canceled (810) 35.27
Outstanding at February 3, 2013 16,617 $ 34.23
The total intrinsic value of stock options exercised was $246 million, $47 million and $9 million in fiscal 2012, 2011 and
2010, respectively. As of February 3, 2013, there were approximately 17 million stock options outstanding with a weighted
average remaining life of six years and an intrinsic value of $550 million. As of February 3, 2013, there were approximately 6
million stock options exercisable with a weighted average exercise price of $32.08, a weighted average remaining life of four
years, and an intrinsic value of $224 million. As of February 3, 2013, there were approximately 13 million stock options
vested or expected to ultimately vest. As of February 3, 2013, there was $40 million of unamortized stock-based
compensation expense related to stock options, which is expected to be recognized over a weighted average period of
two years.
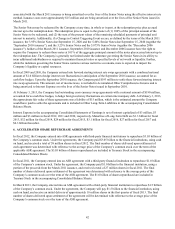
The following table summarizes restricted stock and performance shares outstanding at February 3, 2013, January 29, 2012
and January 30, 2011, and changes during the fiscal years ended on these dates (shares in thousands):
Number of
Shares
Weighted
Average Grant
Date Fair Value
Outstanding at January 31, 2010 20,663 $ 30.11
Granted 5,799 32.31
Restrictions lapsed (5,276) 32.28
Canceled (1,747) 30.11
Outstanding at January 30, 2011 19,439 $ 30.18
Granted 5,776 35.83
Restrictions lapsed (7,937) 31.00
Canceled (1,537) 30.48
Outstanding at January 29, 2012 15,741 $ 31.81
Granted 3,965 49.18
Restrictions lapsed (5,295) 30.62
Canceled (1,172) 35.29
Outstanding at February 3, 2013 13,239 $ 37.18
As of February 3, 2013, there was $278 million of unamortized stock-based compensation expense related to restricted stock
and performance shares, which is expected to be recognized over a weighted average period of two years. The total fair value