Home Depot 2010 Annual Report Download - page 59
Download and view the complete annual report
Please find page 59 of the 2010 Home Depot annual report below. You can navigate through the pages in the report by either clicking on the pages listed below, or by using the keyword search tool below to find specific information within the annual report.-
 1
1 -
2
-
3
-
4
-
5
-
6
-
7
-
8
-
9
-
10
-
11
-
12
-
13
-
14
-
15
-
16
-
17
-
18
-
19
-
20
-
21
-
22
-
23
-
24
-
25
-
26
-
27
-
28
-
29
-
30
-
31
-
32
-
33
-
34
-
35
-
36
-
37
-
38
-
39
-
40
-
41
-
42
-
43
-
44
-
45
-
46
-
47
-
48
-
 49
49 -
 50
50 -
 51
51 -
 52
52 -
 53
53 -
 54
54 -
 55
55 -
 56
56 -
 57
57 -
 58
58 -
 59
59 -
 60
60 -
 61
61 -
 62
62 -
 63
63 -
 64
64 -
 65
65 -
 66
66 -
 67
67 -
 68
68 -
 69
69 -
70
-
71
-
72
 |
 |

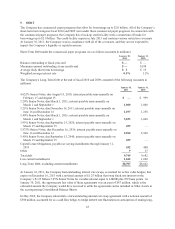
During fiscal 2009, the Company impaired the remaining value of its investment in HD Supply using fair value
measurements with unobservable inputs (level 3), as further discussed in Note 4. Lease obligation costs included
in the Company’s Rationalization Charges were measured on a nonrecurring basis using fair value measurements
with unobservable inputs (level 3), as further discussed in Note 2. Additionally, the guarantee of the HD Supply
loan was measured on a nonrecurring basis using fair value measurements with unobservable inputs (level 3), as
further discussed in Note 4.
Long-lived assets and goodwill and other intangible assets were also analyzed for impairment on a nonrecurring
basis using fair value measurements with unobservable inputs (level 3). Impairment charges related to goodwill
and other intangible assets and long-lived assets in fiscal 2010 and 2009 were not material, as further discussed
in Note 1 under the captions “Goodwill and Other Intangible Assets” and “Impairment of Long-Lived Assets,”
respectively.
The aggregate fair value of the Company’s Senior Notes, based on quoted market prices (level 1), was $9.8
billion and $9.5 billion at January 30, 2011 and January 31, 2010, respectively, compared to a carrying value of
$9.3 billion at both January 30, 2011 and January 31, 2010.
12. COMMITMENTS AND CONTINGENCIES
At January 30, 2011, the Company was contingently liable for approximately $606 million under outstanding
letters of credit and open accounts issued for certain business transactions, including insurance programs, trade
contracts and construction contracts. The Company’s letters of credit are primarily performance-based and are
not based on changes in variable components, a liability or an equity security of the other party.
The Company is involved in litigation arising from the normal course of business. In management’s opinion, this
litigation is not expected to have a material adverse effect on the Company’s consolidated financial condition or
results of operations.
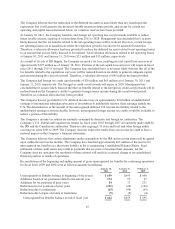
13. QUARTERLY FINANCIAL DATA (UNAUDITED)
The following is a summary of the quarterly consolidated results of operations from continuing operations for the
fiscal years ended January 30, 2011 and January 31, 2010 (amounts in millions, except per share data):
Net Sales Gross
Profit
Earnings from
Continuing
Operations
Basic
Earnings per
Share from
Continuing
Operations
Diluted
Earnings per
Share from
Continuing
Operations
Fiscal Year Ended January 30, 2011:
First Quarter $16,863 $ 5,794 $ 725 $ 0.43 $ 0.43
Second Quarter 19,410 6,582 1,192 0.72 0.72
Third Quarter 16,598 5,685 834 0.51 0.51
Fourth Quarter 15,126 5,243 587 0.36 0.36
Fiscal Year $67,997 $23,304 $3,338 $ 2.03 $ 2.01
Fiscal Year Ended January 31, 2010:
First Quarter $16,175 $ 5,450 $ 514 $ 0.31 $ 0.30
Second Quarter 19,071 6,388 1,116 0.66 0.66
Third Quarter 16,361 5,561 689 0.41 0.41
Fourth Quarter 14,569 5,013 301 0.18 0.18
Fiscal Year $66,176 $22,412 $2,620 $ 1.56 $ 1.55
Note: The quarterly data may not sum to fiscal year totals.
53