Home Depot 2010 Annual Report Download - page 29
Download and view the complete annual report
Please find page 29 of the 2010 Home Depot annual report below. You can navigate through the pages in the report by either clicking on the pages listed below, or by using the keyword search tool below to find specific information within the annual report.-
 1
1 -
2
-
3
-
4
-
5
-
6
-
7
-
8
-
9
-
10
-
11
-
12
-
13
-
14
-
15
-
16
-
17
-
18
-
 19
19 -
 20
20 -
 21
21 -
 22
22 -
 23
23 -
 24
24 -
 25
25 -
 26
26 -
 27
27 -
 28
28 -
 29
29 -
 30
30 -
 31
31 -
 32
32 -
 33
33 -
 34
34 -
 35
35 -
 36
36 -
 37
37 -
 38
38 -
 39
39 -
40
-
41
-
42
-
43
-
44
-
45
-
46
-
47
-
48
-
49
-
50
-
51
-
52
-
53
-
54
-
55
-
56
-
57
-
58
-
59
-
60
-
61
-
62
-
63
-
64
-
65
-
66
-
67
-
68
-
69
-
70
-
71
-
72
 |
 |

Charges, SG&A as a percent of Net Sales was 23.9% for fiscal 2009 compared to 23.7% for fiscal 2008. Our
SG&A results for fiscal 2009 reflect the impact of a negative comparable store sales environment, offset by a
lower cost of credit associated with the private label credit card program and solid expense control. For fiscal
2009, the penetration of the private label credit card sales was 25.1% compared to 28.1% for fiscal 2008.
Depreciation and Amortization decreased 4.4% to $1.7 billion for fiscal 2009 from $1.8 billion for fiscal 2008.
Depreciation and Amortization as a percent of Net Sales was 2.6% for fiscal 2009 and 2.5% for fiscal 2008. The
increase in Depreciation and Amortization as a percent of Net Sales was primarily due to lower sales.
Operating Income
Operating Income increased 10.2% to $4.8 billion for fiscal 2009 from $4.4 billion for fiscal 2008. Operating
Income as a percent of Net Sales was 7.3% for fiscal 2009 compared to 6.1% for fiscal 2008. Excluding the
Rationalization Charges, Operating Income as a percent of Net Sales was 7.5% for fiscal 2009 compared to 7.4%
for fiscal 2008.
Interest and Other, net
In fiscal 2009, we recognized $821 million of Interest and Other, net, compared to $769 million in fiscal 2008.
Interest and Other, net, as a percent of Net Sales was 1.2% for fiscal 2009 compared to 1.1% for fiscal 2008.
Interest and Other, net, reflects a $163 million charge in each of fiscal 2009 and 2008 to write-down our
investment in HD Supply. Excluding these charges, Interest and Other, net, as a percent of Net Sales was 1.0%
for fiscal 2009 compared to 0.9% for fiscal 2008. The increase in Interest and Other, net, as a percent of Net
Sales was primarily due to lower sales.
Provision for Income Taxes
Our combined effective income tax rate for continuing operations decreased to 34.2% for fiscal 2009 from 35.6%
for fiscal 2008. The decrease in our effective income tax rate for fiscal 2009 reflects benefits arising from a
favorable foreign tax settlement and a realignment of our foreign corporate structure.
Diluted Earnings per Share from Continuing Operations
Diluted Earnings per Share from Continuing Operations were $1.55 for fiscal 2009 and $1.37 for fiscal 2008.
Excluding the Rationalization Charges and the write-downs of our investment in HD Supply, Diluted Earnings per
Share from Continuing Operations for fiscal 2009 were $1.66 compared to $1.78 for fiscal 2008, a decrease of 6.7%.
Discontinued Operations
On August 30, 2007, the Company closed the sale of HD Supply. Discontinued operations for fiscal 2009 consist
of earnings of $41 million, net of tax, or $0.02 per diluted share, compared to a loss of $52 million, net of tax, or
$0.03 per diluted share in fiscal 2008, in each case for the settlement of working capital matters arising from the
sale of HD Supply.
Liquidity and Capital Resources
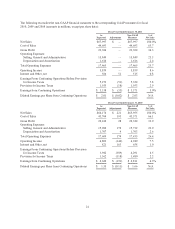
Cash flow generated from operations provides us with a significant source of liquidity. For fiscal 2010, Net Cash
Provided by Operating Activities was approximately $4.6 billion compared to approximately $5.1 billion for
fiscal 2009. This decrease was primarily a result of changes in inventory levels and other net working capital
items partially offset by increased earnings.
Net Cash Used in Investing Activities for fiscal 2010 was $1.0 billion compared to $755 million for fiscal 2009.
This change was primarily due to increased Capital Expenditures and lower Proceeds from Sales of Property and
Equipment.
23