Home Depot 2010 Annual Report Download - page 38
Download and view the complete annual report
Please find page 38 of the 2010 Home Depot annual report below. You can navigate through the pages in the report by either clicking on the pages listed below, or by using the keyword search tool below to find specific information within the annual report.-
 1
1 -
2
-
3
-
4
-
5
-
6
-
7
-
8
-
9
-
10
-
11
-
12
-
13
-
14
-
15
-
16
-
17
-
18
-
19
-
20
-
21
-
22
-
23
-
24
-
25
-
26
-
27
-
 28
28 -
 29
29 -
 30
30 -
 31
31 -
 32
32 -
 33
33 -
 34
34 -
 35
35 -
 36
36 -
 37
37 -
 38
38 -
 39
39 -
 40
40 -
 41
41 -
 42
42 -
 43
43 -
 44
44 -
 45
45 -
 46
46 -
 47
47 -
 48
48 -
49
-
50
-
51
-
52
-
53
-
54
-
55
-
56
-
57
-
58
-
59
-
60
-
61
-
62
-
63
-
64
-
65
-
66
-
67
-
68
-
69
-
70
-
71
-
72
 |
 |

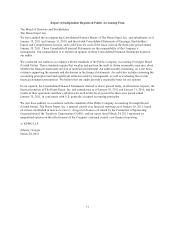
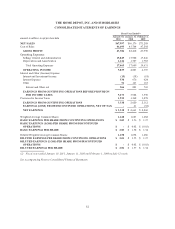
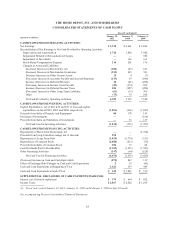
THE HOME DEPOT, INC. AND SUBSIDIARIES
CONSOLIDATED STATEMENTS OF EARNINGS
Fiscal Year Ended(1)
amounts in millions, except per share data January 30,
2011 January 31,
2010 February 1,
2009
NET SALES $67,997 $66,176 $71,288
Cost of Sales 44,693 43,764 47,298
GROSS PROFIT 23,304 22,412 23,990
Operating Expenses:
Selling, General and Administrative 15,849 15,902 17,846
Depreciation and Amortization 1,616 1,707 1,785
Total Operating Expenses 17,465 17,609 19,631
OPERATING INCOME 5,839 4,803 4,359
Interest and Other (Income) Expense:
Interest and Investment Income (15) (18) (18)
Interest Expense 530 676 624
Other 51 163 163
Interest and Other, net 566 821 769
EARNINGS FROM CONTINUING OPERATIONS BEFORE PROVISION
FOR INCOME TAXES 5,273 3,982 3,590
Provision for Income Taxes 1,935 1,362 1,278
EARNINGS FROM CONTINUING OPERATIONS 3,338 2,620 2,312
EARNINGS (LOSS) FROM DISCONTINUED OPERATIONS, NET OF TAX - 41 (52)
NET EARNINGS $ 3,338 $ 2,661 $ 2,260
Weighted Average Common Shares 1,648 1,683 1,682
BASIC EARNINGS PER SHARE FROM CONTINUING OPERATIONS $ 2.03 $ 1.56 $ 1.37
BASIC EARNINGS (LOSS) PER SHARE FROM DISCONTINUED
OPERATIONS $ - $ 0.02 $ (0.03)
BASIC EARNINGS PER SHARE $ 2.03 $ 1.58 $ 1.34
Diluted Weighted Average Common Shares 1,658 1,692 1,686
DILUTED EARNINGS PER SHARE FROM CONTINUING OPERATIONS
$ 2.01 $ 1.55 $ 1.37
DILUTED EARNINGS (LOSS) PER SHARE FROM DISCONTINUED
OPERATIONS $ - $ 0.02 $ (0.03)
DILUTED EARNINGS PER SHARE $ 2.01 $ 1.57 $ 1.34
(1) Fiscal years ended January 30, 2011, January 31, 2010 and February 1, 2009 include 52 weeks.
See accompanying Notes to Consolidated Financial Statements.
32