Home Depot 2010 Annual Report Download - page 23
Download and view the complete annual report
Please find page 23 of the 2010 Home Depot annual report below. You can navigate through the pages in the report by either clicking on the pages listed below, or by using the keyword search tool below to find specific information within the annual report.-
 1
1 -
2
-
3
-
4
-
5
-
6
-
7
-
8
-
9
-
10
-
11
-
12
-
 13
13 -
 14
14 -
 15
15 -
 16
16 -
 17
17 -
 18
18 -
 19
19 -
 20
20 -
 21
21 -
 22
22 -
 23
23 -
 24
24 -
 25
25 -
 26
26 -
 27
27 -
 28
28 -
 29
29 -
 30
30 -
 31
31 -
 32
32 -
 33
33 -
34
-
35
-
36
-
37
-
38
-
39
-
40
-
41
-
42
-
43
-
44
-
45
-
46
-
47
-
48
-
49
-
50
-
51
-
52
-
53
-
54
-
55
-
56
-
57
-
58
-
59
-
60
-
61
-
62
-
63
-
64
-
65
-
66
-
67
-
68
-
69
-
70
-
71
-
72
 |
 |
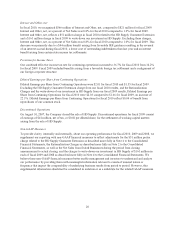
Productivity and Efficiency – Our approach to driving productivity and efficiency starts with disciplined capital
allocation focused on building best-in-class competitive advantages in information technology and supply chain,
as well as building shareholder value through higher returns on invested capital and total value returned to
shareholders in the form of dividends and share repurchases. At the end of fiscal 2010, we completed the roll out
of our Rapid Deployment Centers (“RDCs”) and now have 19 RDCs that serve 100% of our U.S. stores. Also
during fiscal 2010, we repurchased 80.9 million shares for $2.6 billion, and on February 22, 2011 we announced
a six percent increase in our quarterly cash dividend to 25 cents per share.
Interconnected Retail – Our focus on interconnected retail is based on the view that providing a seamless
shopping experience across multiple channels will be a critical enabler for future success. Our multiple channel
focus is allowing us to greatly expand our assortment of merchandise, and we are making the investment to build
these capabilities, including the roll out of “buy on-line, pick-up in store” next year. We are committed to having
a best-in-class website, and during fiscal 2010 our site was named as a Most Improved Website for customer
satisfaction by Foresee, a leading customer satisfaction analytics firm.
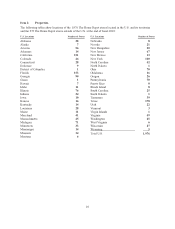
We opened eight new stores in fiscal 2010, including one relocation, and closed three stores, bringing our total
store count at the end of fiscal 2010 to 2,248. As of the end of fiscal 2010, a total of 272 of these stores, or
12.1%, were located in Canada, Mexico and China compared to 268 stores, or 11.9%, at the end of fiscal 2009.
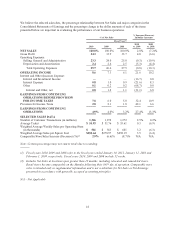
We generated approximately $4.6 billion of cash flow from operations in fiscal 2010. We used this cash flow
along with cash on hand to fund $2.6 billion of share repurchases, pay $1.6 billion of dividends and fund $1.1
billion in capital expenditures.
At the end of fiscal 2010, our long-term debt-to-equity ratio was 46.1% compared to 44.7% at the end of fiscal
2009. Our return on invested capital for continuing operations (computed on net operating profit after tax for the
trailing twelve months and the average of beginning and ending long-term debt and equity) was 12.8% for fiscal
2010 compared to 10.7% for fiscal 2009. This increase reflects the impact of the Rationalization Charges which
were included in our operating profit for fiscal 2009. Excluding the Rationalization Charges, our return on
invested capital for continuing operations was 12.7% for fiscal 2010 compared to 11.1% for fiscal 2009.
17