Home Depot 2010 Annual Report Download - page 28
Download and view the complete annual report
Please find page 28 of the 2010 Home Depot annual report below. You can navigate through the pages in the report by either clicking on the pages listed below, or by using the keyword search tool below to find specific information within the annual report.-
 1
1 -
2
-
3
-
4
-
5
-
6
-
7
-
8
-
9
-
10
-
11
-
12
-
13
-
14
-
15
-
16
-
17
-
 18
18 -
 19
19 -
 20
20 -
 21
21 -
 22
22 -
 23
23 -
 24
24 -
 25
25 -
 26
26 -
 27
27 -
 28
28 -
 29
29 -
 30
30 -
 31
31 -
 32
32 -
 33
33 -
 34
34 -
 35
35 -
 36
36 -
 37
37 -
 38
38 -
39
-
40
-
41
-
42
-
43
-
44
-
45
-
46
-
47
-
48
-
49
-
50
-
51
-
52
-
53
-
54
-
55
-
56
-
57
-
58
-
59
-
60
-
61
-
62
-
63
-
64
-
65
-
66
-
67
-
68
-
69
-
70
-
71
-
72
 |
 |

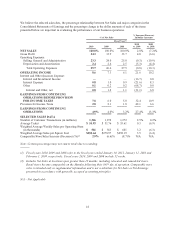
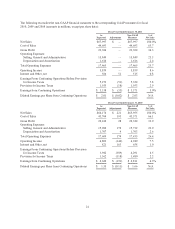
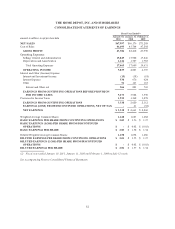
Non-GAAP Measures (continued):
Fiscal Year Ended February 1, 2009
As
Reported Adjustments Non-GAAP
Measures %of
Net Sales
Net Sales $71,288 $ — $71,288 100.0%
Cost of Sales 47,298 30 47,268 66.3
Gross Profit 23,990 (30) 24,020 33.7
Operating Expenses:
Selling, General and Administrative 17,846 918 16,928 23.7
Depreciation and Amortization 1,785 3 1,782 2.5
Total Operating Expenses 19,631 921 18,710 26.2
Operating Income 4,359 (951) 5,310 7.4
Interest and Other, net 769 163 606 0.9
Earnings From Continuing Operations Before Provision
for Income Taxes 3,590 (1,114) 4,704 6.6
Provision for Income Taxes 1,278 (430) 1,708 2.4
Earnings from Continuing Operations $ 2,312 $ (684) $ 2,996 4.2%
Diluted Earnings per Share from Continuing Operations $ 1.37 $ (0.41) $ 1.78 N/A
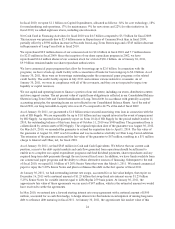
Fiscal 2009 Compared to Fiscal Year Ended February 1, 2009 (“fiscal 2008”)
Net Sales
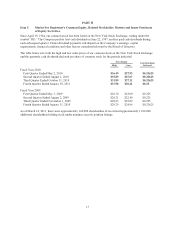
Net Sales for fiscal 2009 decreased 7.2% to $66.2 billion from $71.3 billion for fiscal 2008. The decrease in Net
Sales for fiscal 2009 reflects the impact of negative comparable store sales as well as the net impact of fewer
open stores in fiscal 2009 versus fiscal 2008. Total comparable store sales decreased 6.6% for fiscal 2009
compared to a decrease of 8.7% for fiscal 2008.
There were a number of factors that contributed to our comparable store sales decline. The U.S. residential
construction, housing and home improvement markets continued to be soft, and consumers were challenged due
to a number of factors including higher unemployment. We saw relative strength in our Building Materials,
Flooring, Paint, Plumbing and Garden/Seasonal product categories as comparable store sales in these areas were
above the Company average for fiscal 2009. Comparable store sales for our Lumber, Hardware, Electrical,
Kitchen/Bath and Millwork product categories were below the Company average for fiscal 2009. In fiscal 2009,
we also saw significant strengthening of the U.S. dollar against all currencies. Fluctuating exchange rates
negatively impacted our total Company sales by approximately $565 million for fiscal 2009 compared to fiscal
2008.
Gross Profit
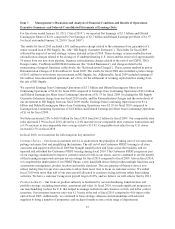
Gross Profit decreased 6.6% to $22.4 billion for fiscal 2009 from $24.0 billion for fiscal 2008. Gross Profit as a
percent of Net Sales was 33.9% for fiscal 2009 compared to 33.7% for fiscal 2008, an increase of 22 basis points.
Through our focused bay portfolio approach, our U.S. merchants continued to introduce new lower prices while
growing overall gross margin. Additionally, gross margin expansion for fiscal 2009 was driven by lower
markdowns as compared to fiscal 2008.
Operating Expenses
SG&A decreased 10.9% to $15.9 billion for fiscal 2009 from $17.8 billion for fiscal 2008. As a percent of Net
Sales, SG&A was 24.0% for fiscal 2009 compared to 25.0% for fiscal 2008. Excluding the Rationalization
22