Home Depot 2010 Annual Report Download - page 25
Download and view the complete annual report
Please find page 25 of the 2010 Home Depot annual report below. You can navigate through the pages in the report by either clicking on the pages listed below, or by using the keyword search tool below to find specific information within the annual report.-
 1
1 -
2
-
3
-
4
-
5
-
6
-
7
-
8
-
9
-
10
-
11
-
12
-
13
-
14
-
 15
15 -
 16
16 -
 17
17 -
 18
18 -
 19
19 -
 20
20 -
 21
21 -
 22
22 -
 23
23 -
 24
24 -
 25
25 -
 26
26 -
 27
27 -
 28
28 -
 29
29 -
 30
30 -
 31
31 -
 32
32 -
 33
33 -
 34
34 -
 35
35 -
36
-
37
-
38
-
39
-
40
-
41
-
42
-
43
-
44
-
45
-
46
-
47
-
48
-
49
-
50
-
51
-
52
-
53
-
54
-
55
-
56
-
57
-
58
-
59
-
60
-
61
-
62
-
63
-
64
-
65
-
66
-
67
-
68
-
69
-
70
-
71
-
72
 |
 |

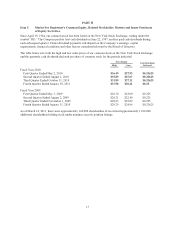
Results of Operations
For an understanding of the significant factors that influenced our performance during the past three fiscal years,
the following discussion should be read in conjunction with the Consolidated Financial Statements and the Notes
to Consolidated Financial Statements presented in this report.
Fiscal 2010 Compared to Fiscal 2009
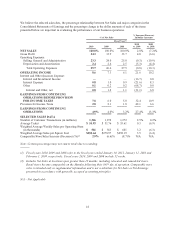
Net Sales
Net Sales for fiscal 2010 increased 2.8% to $68.0 billion from $66.2 billion for fiscal 2009. The increase in Net
Sales for fiscal 2010 reflects the impact of positive comparable store sales. Total comparable store sales
increased 2.9% for fiscal 2010 compared to a decrease of 6.6% for fiscal 2009.
The increase in comparable store sales for fiscal 2010 reflects a number of factors. We experienced positive
comparable store sales in 11 of our 13 departments for fiscal 2010. Comparable store sales for our Lumber,
Tools, Electrical, Indoor Garden, Outdoor Garden and Kitchen/Bath product categories were above the Company
average for fiscal 2010. The increase in comparable store sales also reflects a 2.4% increase in our comparable
store customer transactions and a 0.5% increase in our comparable store average ticket to $51.93.
We believe that our sales performance has been, and could continue to be, negatively impacted by the level of
competition that we encounter in various markets. We estimate our share of the U.S. home improvement market
is approximately 26% using the U.S. Census Bureau’s North American Industry Classification System, or
NAICS, 4441 classification for building material and supplies dealers.
Gross Profit
Gross Profit increased 4.0% to $23.3 billion for fiscal 2010 from $22.4 billion for fiscal 2009. Gross Profit as a
percent of Net Sales was 34.3% for fiscal 2010 compared to 33.9% for fiscal 2009, an increase of 40 basis points.
Our U.S. stores experienced gross profit margin expansion in fiscal 2010 as we realized benefits from better
product assortment management through our portfolio approach and leveraging of our newly developed
merchandising tools. Lower levels of clearance inventory in our stores for fiscal 2010 compared to last year also
contributed to this expansion. Additionally, we realized gross profit margin expansion from our non-U.S.
businesses, primarily Canada, due primarily to a change in the mix of products sold.
Operating Expenses
Selling, General and Administrative expenses (“SG&A”) decreased 0.3% to $15.8 billion for fiscal 2010 from
$15.9 billion for fiscal 2009. As a percent of Net Sales, SG&A was 23.3% for fiscal 2010 compared to 24.0% for
fiscal 2009. Excluding the Rationalization Charges, SG&A as a percent of Net Sales was 23.9% for fiscal 2009.
The decrease in SG&A as a percent of Net Sales for fiscal 2010 reflects expense leverage in the positive
comparable store sales environment and lower payroll and other expenses.
Depreciation and Amortization decreased 5.3% to $1.6 billion for fiscal 2010 from $1.7 billion for fiscal 2009.
Depreciation and Amortization as a percent of Net Sales was 2.4% for fiscal 2010 compared to 2.6% for fiscal
2009. The decrease in Depreciation and Amortization as a percent of Net Sales was primarily due to a smaller
depreciable fixed asset base compared to last year, arising from fully depreciated assets.
Operating Income
Operating Income increased 21.6% to $5.8 billion for fiscal 2010 from $4.8 billion for fiscal 2009. Operating
Income as a percent of Net Sales was 8.6% for fiscal 2010 compared to 7.3% for fiscal 2009. Excluding the
Rationalization Charges from the results of fiscal 2009, Operating Income increased 18.0% for fiscal 2010.
19