Home Depot 2010 Annual Report Download - page 27
Download and view the complete annual report
Please find page 27 of the 2010 Home Depot annual report below. You can navigate through the pages in the report by either clicking on the pages listed below, or by using the keyword search tool below to find specific information within the annual report.-
 1
1 -
2
-
3
-
4
-
5
-
6
-
7
-
8
-
9
-
10
-
11
-
12
-
13
-
14
-
15
-
16
-
 17
17 -
 18
18 -
 19
19 -
 20
20 -
 21
21 -
 22
22 -
 23
23 -
 24
24 -
 25
25 -
 26
26 -
 27
27 -
 28
28 -
 29
29 -
 30
30 -
 31
31 -
 32
32 -
 33
33 -
 34
34 -
 35
35 -
 36
36 -
 37
37 -
38
-
39
-
40
-
41
-
42
-
43
-
44
-
45
-
46
-
47
-
48
-
49
-
50
-
51
-
52
-
53
-
54
-
55
-
56
-
57
-
58
-
59
-
60
-
61
-
62
-
63
-
64
-
65
-
66
-
67
-
68
-
69
-
70
-
71
-
72
 |
 |

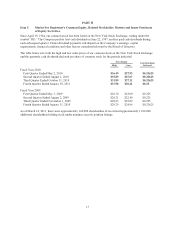
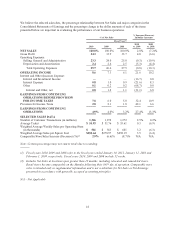
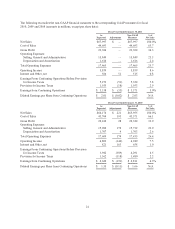
The following reconciles the non-GAAP financial measures to the corresponding GAAP measures for fiscal
2010, 2009 and 2008 (amounts in millions, except per share data):
Fiscal Year Ended January 30, 2011
As
Reported Adjustment Non-GAAP
Measures %of
Net Sales
Net Sales $67,997 $ — $67,997 100.0%
Cost of Sales 44,693 — 44,693 65.7
Gross Profit 23,304 — 23,304 34.3
Operating Expenses:
Selling, General and Administrative 15,849 — 15,849 23.3
Depreciation and Amortization 1,616 — 1,616 2.4
Total Operating Expenses 17,465 — 17,465 25.7
Operating Income 5,839 — 5,839 8.6
Interest and Other, net 566 51 515 0.8
Earnings From Continuing Operations Before Provision
for Income Taxes 5,273 (51) 5,324 7.8
Provision for Income Taxes 1,935 (18) 1,953 2.9
Earnings from Continuing Operations $ 3,338 $ (33) $ 3,371 5.0%
Diluted Earnings per Share from Continuing Operations $ 2.01 $ (0.02) $ 2.03 N/A
Fiscal Year Ended January 31, 2010
As
Reported Adjustments Non-GAAP
Measures %of
Net Sales
Net Sales $66,176 $ 221 $65,955 100.0%
Cost of Sales 43,764 193 43,571 66.1
Gross Profit 22,412 28 22,384 33.9
Operating Expenses:
Selling, General and Administrative 15,902 170 15,732 23.9
Depreciation and Amortization 1,707 4 1,703 2.6
Total Operating Expenses 17,609 174 17,435 26.4
Operating Income 4,803 (146) 4,949 7.5
Interest and Other, net 821 163 658 1.0
Earnings From Continuing Operations Before Provision
for Income Taxes 3,982 (309) 4,291 6.5
Provision for Income Taxes 1,362 (118) 1,480 2.2
Earnings from Continuing Operations $ 2,620 $ (191) $ 2,811 4.3%
Diluted Earnings per Share from Continuing Operations $ 1.55 $ (0.11) $ 1.66 N/A
21