Home Depot 2010 Annual Report Download - page 22
Download and view the complete annual report
Please find page 22 of the 2010 Home Depot annual report below. You can navigate through the pages in the report by either clicking on the pages listed below, or by using the keyword search tool below to find specific information within the annual report.-
 1
1 -
2
-
3
-
4
-
5
-
6
-
7
-
8
-
9
-
10
-
11
-
 12
12 -
 13
13 -
 14
14 -
 15
15 -
 16
16 -
 17
17 -
 18
18 -
 19
19 -
 20
20 -
 21
21 -
 22
22 -
 23
23 -
 24
24 -
 25
25 -
 26
26 -
 27
27 -
 28
28 -
 29
29 -
 30
30 -
 31
31 -
 32
32 -
33
-
34
-
35
-
36
-
37
-
38
-
39
-
40
-
41
-
42
-
43
-
44
-
45
-
46
-
47
-
48
-
49
-
50
-
51
-
52
-
53
-
54
-
55
-
56
-
57
-
58
-
59
-
60
-
61
-
62
-
63
-
64
-
65
-
66
-
67
-
68
-
69
-
70
-
71
-
72
 |
 |

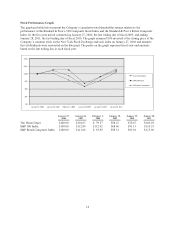
Item 7. Management’s Discussion and Analysis of Financial Condition and Results of Operations.
Executive Summary and Selected Consolidated Statements of Earnings Data
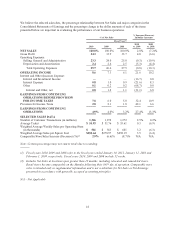
For fiscal year ended January 30, 2011 (“fiscal 2010”), we reported Net Earnings of $3.3 billion and Diluted
Earnings per Share of $2.01 compared to Net Earnings of $2.7 billion and Diluted Earnings per Share of $1.57
for fiscal year ended January 31, 2010 (“fiscal 2009”).
The results for fiscal 2010 included a $51 million pretax charge related to the extension of our guarantee of a
senior secured loan of HD Supply, Inc. (the “HD Supply Guarantee Extension”). The results for fiscal 2009
reflected the impact of several strategic actions initiated in fiscal 2008. These strategic actions resulted in store
rationalization charges related to the closing of 15 underperforming U.S. stores and the removal of approximately
50 stores from our new store pipeline, business rationalization charges related to the exit of our EXPO, THD
Design Center, Yardbirds and HD Bath businesses (the “Exited Businesses”) and charges related to the
restructuring of support functions (collectively, the “Rationalization Charges”). These actions resulted in pretax
Rationalization Charges of $146 million for fiscal 2009. The results for fiscal 2009 also included a pretax charge
of $163 million to write-down our investment in HD Supply, Inc. Additionally, fiscal 2009 included earnings of
$41 million from discontinued operations, net of tax, for the settlement of working capital matters arising from
the sale of HD Supply.
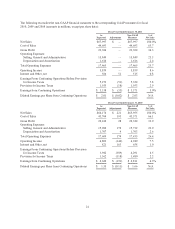
We reported Earnings from Continuing Operations of $3.3 billion and Diluted Earnings per Share from
Continuing Operations of $2.01 for fiscal 2010 compared to Earnings from Continuing Operations of $2.6 billion
and Diluted Earnings per Share from Continuing Operations of $1.55 for fiscal 2009. Excluding the HD Supply
Guarantee Extension charge from our fiscal 2010 results, and the Rationalization Charges and the write-down of
our investment in HD Supply from our fiscal 2009 results, Earnings from Continuing Operations were $3.4
billion and Diluted Earnings per Share from Continuing Operations were $2.03 for fiscal 2010 compared to
Earnings from Continuing Operations of $2.8 billion and Diluted Earnings per Share from Continuing Operations
of $1.66 for fiscal 2009.
Net Sales increased 2.8% to $68.0 billion for fiscal 2010 from $66.2 billion for fiscal 2009. Our comparable store
sales increased 2.9% in fiscal 2010, driven by a 2.4% increase in our comparable store customer transactions and
a 0.5% increase in our comparable store average ticket to $51.93. Comparable store sales for our U.S. stores
increased 2.5% in fiscal 2010.
In fiscal 2010, we focused on the following four key initiatives:
Customer Service – Our focus on customer service is anchored on the principles of taking care of our associates,
putting customers first and simplifying the business. The roll out of our Customers FIRST training to all store
associates and support staff in fiscal 2009 has brought simplification and focus across the business, and we
repeated and refreshed the Customers FIRST training during fiscal 2010. The Customers FIRST program is part
of our ongoing commitment to improve customer service levels in our stores, and we continued to see the benefit
of this training in improved customer service ratings for fiscal 2010 compared to fiscal 2009. Also in fiscal 2010,
we completed the deployment of our FIRST Phone, a new hand held device that provides multiple functions such
as inventory management, product location and mobile checkout. The core purpose of this new device is to
reduce tasking time for our store associates to allow them more time to focus on customer service. We ended
fiscal 2010 with more than half of our store payroll allocated to customer facing activities rather than tasking
activities. We have a customer facing store payroll target of 60%, and we believe we will achieve that by 2013.
Product Authority – Our focus on product authority is facilitated by our merchandising transformation and
portfolio strategy, including innovation, assortment and value. In fiscal 2010, we made significant progress on
our merchandising tools in the U.S. that helped us manage markdown and clearance activity and better control
inventory. Our inventory turnover ratio was 4.13 times at the end of fiscal 2010 compared to 4.06 times at the
end of fiscal 2009. Additionally, we continued to form strategic alliances and relationships with selected
suppliers to bring a number of proprietary and exclusive brands across a wide range of departments.
16