Home Depot 2010 Annual Report Download - page 58
Download and view the complete annual report
Please find page 58 of the 2010 Home Depot annual report below. You can navigate through the pages in the report by either clicking on the pages listed below, or by using the keyword search tool below to find specific information within the annual report.-
 1
1 -
2
-
3
-
4
-
5
-
6
-
7
-
8
-
9
-
10
-
11
-
12
-
13
-
14
-
15
-
16
-
17
-
18
-
19
-
20
-
21
-
22
-
23
-
24
-
25
-
26
-
27
-
28
-
29
-
30
-
31
-
32
-
33
-
34
-
35
-
36
-
37
-
38
-
39
-
40
-
41
-
42
-
43
-
44
-
45
-
46
-
47
-
 48
48 -
 49
49 -
 50
50 -
 51
51 -
 52
52 -
 53
53 -
 54
54 -
 55
55 -
 56
56 -
 57
57 -
 58
58 -
 59
59 -
 60
60 -
 61
61 -
 62
62 -
 63
63 -
 64
64 -
 65
65 -
 66
66 -
 67
67 -
 68
68 -
69
-
70
-
71
-
72
 |
 |

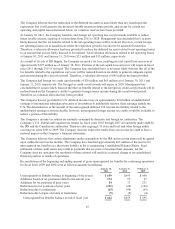
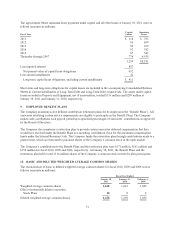
Stock plans consist of shares granted under the Company’s employee stock plans as described in Note 7 to the
Consolidated Financial Statements. Options to purchase 39 million, 48 million and 52 million shares of common
stock at January 30, 2011, January 31, 2010 and February 1, 2009, respectively, were excluded from the
computation of Diluted Earnings per Share because their effect would have been anti-dilutive.
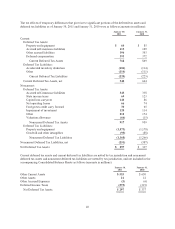
11. FAIR VALUE MEASUREMENTS
The fair value of an asset is considered to be the price at which the asset could be sold in an orderly transaction
between unrelated knowledgeable and willing parties. A liability’s fair value is defined as the amount that would
be paid to transfer the liability to a new obligor, not the amount that would be paid to settle the liability with the
creditor. Assets and liabilities recorded at fair value are measured using a three-tier fair value hierarchy, which
prioritizes the inputs used in measuring fair value. These tiers include:
• Level 1 – Observable inputs that reflect quoted prices in active markets
• Level 2 – Inputs other than quoted prices in active markets that are either directly or indirectly observable
• Level 3 – Unobservable inputs in which little or no market data exists, therefore requiring the Company to
develop its own assumptions
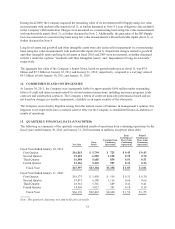
Assets and Liabilities Measured at Fair Value on a Recurring Basis
The assets and liabilities of the Company that are measured at fair value on a recurring basis as of January 30,
2011 and January 31, 2010 were as follows (amounts in millions):
Fair Value at
January 30, 2011 Using Fair Value at
January 31, 2010 Using
Level 1 Level 2 Level 3 Level 1 Level 2 Level 3
Derivative agreements - assets $ – $ 47 $ – $ – $15 $ –
Derivative agreements - liabilities – (40) – – (4) –
Total $ – $ 7 $ – $ – $11 $ –
The Company uses derivative financial instruments from time to time in the management of its interest rate
exposure on long-term debt and its exposure on foreign currency fluctuations. The fair value of the Company’s
derivative financial instruments was measured using level 2 inputs. The Company’s derivative agreements are
discussed further in Note 5.
Assets and Liabilities Measured at Fair Value on a Nonrecurring Basis
The assets and liabilities of the Company that were measured at fair value on a nonrecurring basis during fiscal
2010 and fiscal 2009 were as follows (amounts in millions):
Fair Value Measured
During Fiscal 2010
Level 3 Gains (Losses)
Store Rationalization - lease obligation costs, net $(158) $ (9)
Guarantee of HD Supply loan $ (67) (51)
Total for fiscal 2010 $ (60)
Fair Value Measured
During Fiscal 2009
Level 3 Gains (Losses)
HD Supply investment $ — $(163)
Store Rationalization - lease obligation costs, net $(191) (84)
Total for fiscal 2009 $(247)
52