Home Depot 2010 Annual Report Download - page 32
Download and view the complete annual report
Please find page 32 of the 2010 Home Depot annual report below. You can navigate through the pages in the report by either clicking on the pages listed below, or by using the keyword search tool below to find specific information within the annual report.-
 1
1 -
2
-
3
-
4
-
5
-
6
-
7
-
8
-
9
-
10
-
11
-
12
-
13
-
14
-
15
-
16
-
17
-
18
-
19
-
20
-
21
-
 22
22 -
 23
23 -
 24
24 -
 25
25 -
 26
26 -
 27
27 -
 28
28 -
 29
29 -
 30
30 -
 31
31 -
 32
32 -
 33
33 -
 34
34 -
 35
35 -
 36
36 -
 37
37 -
 38
38 -
 39
39 -
 40
40 -
 41
41 -
 42
42 -
43
-
44
-
45
-
46
-
47
-
48
-
49
-
50
-
51
-
52
-
53
-
54
-
55
-
56
-
57
-
58
-
59
-
60
-
61
-
62
-
63
-
64
-
65
-
66
-
67
-
68
-
69
-
70
-
71
-
72
 |
 |

As of January 30, 2011 we had, net of discounts, $9.3 billion of Senior Notes outstanding. The aggregate market
value of the publicly traded Senior Notes as of January 30, 2011 was approximately $9.8 billion.
Although we have international operating entities, our exposure to foreign currency rate fluctuations is not
significant to our financial condition or results of operations.
Impact of Inflation, Deflation and Changing Prices
We have experienced inflation and deflation related to our purchase of certain commodity products. We do not
believe that changing prices for commodities have had a material effect on our Net Sales or results of operations.
Although we cannot precisely determine the overall effect of inflation and deflation on operations, we do not
believe inflation and deflation have had a material effect on our results of operations.
Critical Accounting Policies
Our significant accounting policies are disclosed in Note 1 to the Consolidated Financial Statements. The
following discussion addresses our most critical accounting policies, which are those that are both important to
the portrayal of our financial condition and results of operations and that require significant judgment or use of
significant assumptions or complex estimates.
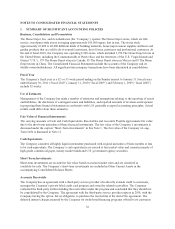
Revenues
We recognize revenue, net of estimated returns and sales tax, at the time the customer takes possession of the
merchandise or receives services. We estimate the liability for sales returns based on our historical return levels.
We believe that our estimate for sales returns is an accurate reflection of future returns. We have never recorded
a significant adjustment to our estimated liability for sales returns. However, if these estimates are significantly
below the actual amounts, our sales could be adversely impacted. When we receive payment from customers
before the customer has taken possession of the merchandise or the service has been performed, the amount
received is recorded as Deferred Revenue in the accompanying Consolidated Balance Sheets until the sale or
service is complete. We also record Deferred Revenue for the sale of gift cards and recognize this revenue upon
the redemption of gift cards in Net Sales.
Merchandise Inventories
Our Merchandise Inventories are stated at the lower of cost (first-in, first-out) or market, with approximately
80% valued under the retail inventory method and the remainder under a cost method. Retailers like us, with
many different types of merchandise at low unit cost and a large number of transactions, frequently use the retail
inventory method. Under the retail inventory method, Merchandise Inventories are stated at cost, which is
determined by applying a cost-to-retail ratio to the ending retail value of inventories. As our inventory retail
value is adjusted regularly to reflect market conditions, our inventory valued under the retail method
approximates the lower of cost or market. We evaluate our inventory valued under a cost method at the end of
each quarter to ensure that it is carried at the lower of cost or market. The valuation allowance for Merchandise
Inventories valued under a cost method was not material to our Consolidated Financial Statements as of the end
of fiscal 2010 or 2009.
Independent physical inventory counts or cycle counts are taken on a regular basis in each store and distribution
center to ensure that amounts reflected in the accompanying Consolidated Financial Statements for Merchandise
Inventories are properly stated. During the period between physical inventory counts in our stores, we accrue for
estimated losses related to shrink on a store-by-store basis. Shrink (or in the case of excess inventory, “swell”) is
the difference between the recorded amount of inventory and the physical inventory. Shrink may occur due to
theft, loss, inaccurate records for the receipt of inventory or deterioration of goods, among other things. We
estimate shrink as a percent of Net Sales using the average shrink results from the previous two physical
inventories. The estimates are evaluated quarterly and adjusted based on recent shrink results and current trends
in the business. Actual shrink results did not vary materially from estimated amounts for fiscal 2010, 2009 or
2008.
26