Home Depot 2003 Annual Report Download - page 33
Download and view the complete annual report
Please find page 33 of the 2003 Home Depot annual report below. You can navigate through the pages in the report by either clicking on the pages listed below, or by using the keyword search tool below to find specific information within the annual report.
The Home Depot, Inc. | 31
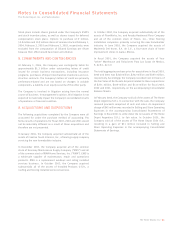
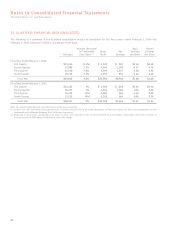
Notes to Consolidated Financial Statements
The Home Depot, Inc. and Subsidiaries
Interest Expense in the accompanying Consolidated Statements
of Earnings is net of interest capitalized of $50 million,
$59 million and $84 million in fiscal 2003, 2002 and 2001, respec-
tively. Maturities of Long-Term Debt are $509 million for fiscal
2004, $10 million for fiscal 2005, $530 million for fiscal 2006,
$12 million for fiscal 2007, $14 million for fiscal 2008 and
$290 million thereafter.
As of February 1, 2004, the market values of the publicly traded
Senior Notes were approximately $515 million and $532 million,
respectively. The estimated fair value of all other long-term
borrowings, excluding capital lease obligations, was approxi-
mately $50 million compared to the carrying value of $47 million.
These fair values were estimated using a discounted cash flow
analysis based on the Company’s incremental borrowing rate for
similar liabilities.
3. INCOME TAXES
The components of Earnings before Provision for Income Taxes for
fiscal 2003, 2002 and 2001 are as follows (amounts in millions):
Fiscal Year Ended
February 1,February 2, February 3,
2004 2003 2002
United States $6,440 $5,571 $4,783
Foreign 403 301 174
Total $6,843 $5,872 $4,957
The Provision for Income Taxes consisted of the following
(amounts in millions):
Fiscal Year Ended
February 1,February 2, February 3,
2004 2003 2002
Current:
Federal $1,520 $1,679 $1,594
State 307 239 265
Foreign 107 117 60
1,934 2,035 1,919
Deferred:
Federal 573 174 (12)
State 27 1 (1)
Foreign 5(2) 7
605 173 (6)
Total $2,539 $2,208 $1,913
The Company’s combined federal, state and foreign effective tax
rates for fiscal 2003, 2002 and 2001, net of offsets generated by
federal, state and foreign tax benefits, were approximately
37.1%, 37.6% and 38.6%, respectively.
A reconciliation of the Provision for Income Taxes at the federal
statutory rate of 35% to actual tax expense for the applicable
fiscal years is as follows (amounts in millions):
Fiscal Year Ended
February 1,February 2, February 3,
2004 2003 2002
Income taxes at
federal statutory rate $2,395 $2,055 $1,735
State income taxes,
net of federal
income tax benefit 217 156 172
Foreign rate differences (29) (1) 4
Other, net (44) (2) 2
Total $2,539 $2,208 $1,913
The tax effects of temporary differences that give rise to
significant portions of the deferred tax assets and deferred tax
liabilities as of February 1, 2004 and February 2, 2003, were as
follows (amounts in millions):
February 1,February 2,
2004 2003
Deferred Tax Assets:
Accrued self-insurance liabilities $ 205 $ 305
Other accrued liabilities 196 92
Net loss on disposition of business 31 31
Total gross deferred tax assets 432 428
Valuation allowance (31) (31)
Deferred tax assets,
net of valuation allowance 401 397
Deferred Tax Liabilities:
Accelerated depreciation (1,114) (571)
Accelerated inventory deduction (218) (149)
Other (36) (39)
Total gross deferred tax liabilities (1,368) (759)
Net deferred tax liability $ (967) $(362)


