Home Depot 2003 Annual Report Download - page 20
Download and view the complete annual report
Please find page 20 of the 2003 Home Depot annual report below. You can navigate through the pages in the report by either clicking on the pages listed below, or by using the keyword search tool below to find specific information within the annual report.-
 1
1 -
2
-
3
-
4
-
5
-
6
-
7
-
8
-
9
-
 10
10 -
 11
11 -
 12
12 -
 13
13 -
 14
14 -
 15
15 -
 16
16 -
 17
17 -
 18
18 -
 19
19 -
 20
20 -
 21
21 -
 22
22 -
 23
23 -
 24
24 -
 25
25 -
 26
26 -
 27
27 -
 28
28 -
 29
29 -
 30
30 -
31
-
32
-
33
-
34
-
35
-
36
-
37
-
38
-
39
-
40
-
41
-
42
-
43
-
44
 |
 |

and Store Operating Expenses. In fiscal 2002 and 2001, advertising
co-op allowances exceeded gross advertising expense by
$30 million and $31 million, respectively. These excess amounts
were recorded as a reduction of Cost of Merchandise Sold in the
accompanying Consolidated Statements of Earnings. In fiscal
2003, net advertising expense was $58 million, which was recorded
in Selling and Store Operating Expenses.
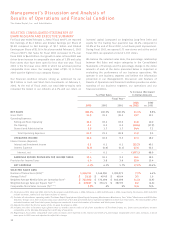
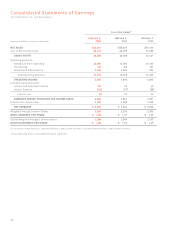
The following table illustrates the full-year effect on Cost of
Merchandise Sold, Gross Profit, Selling and Store Operating
Expenses, Operating Income and Diluted Earnings per Share as
if advertising co-op allowances had always been treated as a
reduction of Cost of Merchandise Sold in accordance with
EITF 02-16 (amounts in millions, except per share data):
Fiscal Year Ended
February 1, February 2, February 3,
2004 2003 2002
Cost of
Merchandise Sold
As Reported $44,236 $40,139 $37,406
Pro Forma 43,295 39,284 36,611
Gross Profit
As Reported 20,580 18,108 16,147
Pro Forma 21,521 18,963 16,942
Selling and Store
Operating Expenses
As Reported 12,502 11,180 10,163
Pro Forma 13,443 12,061 10,969
Operating Income
As Reported 6,846 5,830 4,932
Pro Forma 6,846 5,804 4,921
Diluted Earnings
per Share
As Reported $ 1.88 $ 1.56 $ 1.29
Pro Forma $ 1.88 $ 1.56 $ 1.29
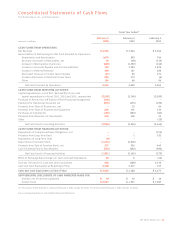
LIQUIDITY AND CAPITAL RESOURCES
Cash flow generated from operations provides us with a significant
source of liquidity. For fiscal 2003, Net Cash Provided by
Operations increased to $6.5 billion from $4.8 billion in fiscal
2002. This increase was primarily driven by stronger Net Earnings,
the timing of tax payments and an improvement in our cash
conversion cycle, or the number of days it takes to convert working
capital into cash.
Net Cash Used in Investing Activities increased to $4.0 billion in
fiscal 2003 from $2.9 billion in fiscal 2002. Capital Expenditures
increased to $3.5 billion in fiscal 2003 from $2.7 billion in fiscal
2002. This increase was due to a higher investment in store
modernization, technology and other initiatives. We opened
175 new stores in fiscal 2003 compared to 203 new stores in
fiscal 2002. Additionally, in December 2003, we exercised an
option to purchase certain assets under a lease agreement at
an original cost of $598 million. After the purchase of these
assets, we now own 86% of our stores. We believe our real estate
ownership strategy is a competitive advantage.
We plan to open 175 new stores in fiscal 2004, including
14 stores in Canada and nine in Mexico, and expect total Capital
Expenditures to be approximately $3.7 billion, allocated as
follows: 57% for new stores, 22% for store modernization, 8% for
technology and 13% for other initiatives.
Net Cash Used in Financing Activities in fiscal 2003 was $1.9 billion
compared with $2.2 billion in fiscal 2002. During fiscal 2002 and
2003, the Board of Directors authorized total repurchases of our
common stock of $4billion pursuant to a Share Repurchase
Program. During fiscal 2003, we repurchased approximately
47 million shares of our common stock for $1.6 billion and during
fiscal 2002 we repurchased 69 million shares of our common
stock for $2.0 billion. As of February 1, 2004, approximately
$400 million remained under our previously authorized Share
Repurchase Program. In addition, in February 2004, our Board of
Directors authorized an increase of $1billion in our authorized
Share Repurchase Program, bringing the total remaining authori-
zation to $1.4 billion. During fiscal 2003, we also increased
dividends paid by 21% to $595 million from $492 million in
fiscal 2002.
We have a commercial paper program that allows borrowings for
up to a maximum of $1billion. As of February 1, 2004, there were
no borrowings outstanding under the program. In connection with
the program, we have a back-up credit facility with a consortium
of banks for up to $800 million. The credit facility, which expires
in September 2004, contains various restrictive covenants, none
of which are expected to impact our liquidity or capital resources.
We intend to renew this credit facility.
We use capital and operating leases, as well as an off-balance
sheet lease created under a structured financing arrangement, to
finance a portion of our real estate, including our stores, distri-
bution centers and store support centers. The net present value
of capital lease obligations is reflected in our Consolidated
Balance Sheets in Long-Term Debt. The off-balance sheet lease
was created to purchase land and fund the construction of certain
stores, office buildings and distribution centers. In accordance
with generally accepted accounting principles, the operating
leases and the off-balance sheet lease were not reflected in our
Consolidated Balance Sheets.
As of the end of fiscal 2003, our total debt-to-equity ratio was
6.1%. If the estimated net present value of future payments under
the operating leases and the off-balance sheet lease were
capitalized, our total debt-to-equity ratio would increase to 27.8%.
Management’s Discussion and Analysis of
Results of Operations and Financial Condition (continued)
The Home Depot, Inc. and Subsidiaries
18