Home Depot 2003 Annual Report Download - page 18
Download and view the complete annual report
Please find page 18 of the 2003 Home Depot annual report below. You can navigate through the pages in the report by either clicking on the pages listed below, or by using the keyword search tool below to find specific information within the annual report.-
 1
1 -
2
-
3
-
4
-
5
-
6
-
7
-
 8
8 -
 9
9 -
 10
10 -
 11
11 -
 12
12 -
 13
13 -
 14
14 -
 15
15 -
 16
16 -
 17
17 -
 18
18 -
 19
19 -
 20
20 -
 21
21 -
 22
22 -
 23
23 -
 24
24 -
 25
25 -
 26
26 -
 27
27 -
 28
28 -
29
-
30
-
31
-
32
-
33
-
34
-
35
-
36
-
37
-
38
-
39
-
40
-
41
-
42
-
43
-
44
 |
 |

business customer (“Pro”) initiative adds programs to our stores
like job lot order quantities of merchandise and a dedicated sales
desk for our Pro customer base. Our Appliance initiative offers
customers an assortment of in-stock name brand appliances,
including General Electric®and Maytag®, and offers the ability to
special order over 2,300 additional related products through com-
puter kiosks located in our stores. Additionally, during fiscal
2003, we continued to implement our DesignplaceSM initiative.
This initiative offers our design and décor customers personalized
service from specially-trained associates and provides distinctive
merchandise in an attractive setting. In fiscal 2003, we also
continued the expansion of our Tool Rental Centers. These
centers, which are located inside our stores, provide a cost
efficient way for our do-it-yourself and Pro customers to complete
home improvement projects.
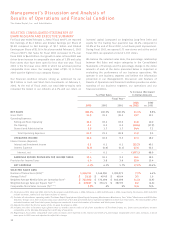
The following table provides the number of stores with
these initiatives:
Fiscal Year
2004 Fiscal Year
Estimate 2003 2002 2001
Store Count 1,882 1,707 1,532 1,333
Initiatives:
Pro 1,434 1,356 1,135 535
Appliance 1,797 1,569 743 73
DesignplaceSM 1,797 1,625 873 205
Tool Rental Centers 1,045 825 601 466
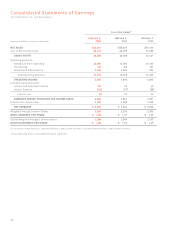
Gross Profit increased 13.7% to $20.6 billion for fiscal 2003 from
$18.1 billion for fiscal 2002. Gross Profit as a percent of Net Sales
was 31.8% for fiscal 2003 compared to 31.1% for fiscal 2002. The
increase in the gross profit rate was attributable to changing
customer preferences and continuing benefits arising from our
centralized purchasing group. Improved inventory management,
which resulted in lower shrink levels, increased penetration of
import products, which typically have a lower cost and benefits
from Tool Rental Centers also positively impacted the gross
profit rate. The adoption of Emerging Issues Task Force 02-16,
“Accounting by a Customer (Including a Reseller) for Certain
Consideration Received from a Vendor” (“EITF 02-16”) also con-
tributed to the increase in Gross Profit in fiscal 2003 and will also
favorably impact Gross Profit in fiscal 2004 (see section
“Adoption of EITF 02-16”).
Operating Expenses increased 11.9% to $13.7 billion for fiscal
2003 from $12.3 billion for fiscal 2002. Operating Expenses as a
percent of Net Sales were 21.2% for fiscal 2003 compared to
21.1% for fiscal 2002.
Selling and Store Operating Expenses, which are included in
Operating Expenses, increased 11.8% to $12.5 billion for fiscal
2003 from $11.2 billion for fiscal 2002. As a percent of Net Sales,
Selling and Store Operating Expenses were 19.3% for fiscal 2003
compared to 19.2% for fiscal 2002. The increase in Selling and
Store Operating Expenses in fiscal 2003 was primarily attributable
to $47 million of advertising expense related to the adoption of
EITF 02-16. Beginning in January 2004, we no longer net certain
advertising co-op allowances against advertising expense. Selling
and Store Operating Expenses will also be negatively impacted in
fiscal 2004 from the adoption of EITF 02-16 (see section
“Adoption of EITF 02-16”). During fiscal 2003, we experienced
rising workers’ compensation and general liability expense, due
to rising medical costs. We also experienced incremental expense
associated with our store modernization program. These rising
costs were offset, however, by increasing levels of sales produc-
tivity by our associates and benefits from our new private label
credit program.
Sales productivity, as measured by sales per labor hour, reached
an all time high in fiscal 2003, as we moved our associates from
tasking to selling activities. And while we expect continued
benefit from our new private label credit program, our plan is to
invest those benefits for future growth in our business.
General and Administrative Expenses increased 14.4% to
$1.1 billion for fiscal 2003 from $1.0 billion for fiscal 2002.
General and Administrative Expenses as a percent of Net Sales
were 1.8% for fiscal 2003 and 1.7% for fiscal 2002. The increase
in fiscal 2003 was primarily due to increased spending in technol-
ogy and other growth initiatives.
In fiscal 2003, we recognized $3million of net Interest Expense
compared to $42 million of net Interest and Investment Income in
fiscal 2002. Net Interest Expense as a percent of Net Sales was
less than 0.1% for fiscal 2003 and net Interest and Investment
Income as a percent of Net Sales was 0.1% for fiscal 2002.
Interest Expense increased 67.6% to $62 million for fiscal 2003
from $37 million for fiscal 2002 primarily due to lower capitalized
interest expense as we had fewer stores under development in
fiscal 2003 as compared to fiscal 2002. Interest Expense also
increased due to the addition of $47 million in capital leases
during the year. Interest and Investment Income decreased 25.3%
to $59 million for fiscal 2003 from $79 million for fiscal 2002 pri-
marily due to lower average cash balances and a lower interest
rate environment.
Our combined federal and state effective income tax rate
decreased to 37.1% for fiscal 2003 from 37.6% for fiscal 2002.
The decrease in our effective tax rate in fiscal 2003 from fiscal
2002 was primarily due to the utilization of certain federal, state
and foreign tax benefits.
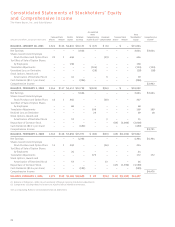
Diluted Earnings per Share were $1.88 and $1.56 in fiscal 2003
and fiscal 2002, respectively. Diluted Earnings per Share were
favorably impacted in fiscal 2003 as a result of the repurchase of
shares of our common stock in fiscal 2002 and fiscal 2003. Over
the past two fiscal years, we have repurchased 115.6 million
shares of our common stock for a total of $3.6 billion. In fiscal
2004, we expect Diluted Earnings per Share growth of 7% to 11%
including the adoption of EITF 02-16.
Management’s Discussion and Analysis of
Results of Operations and Financial Condition (continued)
The Home Depot, Inc. and Subsidiaries
16