Home Depot 2003 Annual Report Download - page 2
Download and view the complete annual report
Please find page 2 of the 2003 Home Depot annual report below. You can navigate through the pages in the report by either clicking on the pages listed below, or by using the keyword search tool below to find specific information within the annual report.-
 1
1 -
 2
2 -
 3
3 -
 4
4 -
 5
5 -
 6
6 -
 7
7 -
 8
8 -
 9
9 -
 10
10 -
 11
11 -
 12
12 -
 13
13 -
14
-
15
-
16
-
17
-
18
-
19
-
20
-
21
-
22
-
23
-
24
-
25
-
26
-
27
-
28
-
29
-
30
-
31
-
32
-
33
-
34
-
35
-
36
-
37
-
38
-
39
-
40
-
41
-
42
-
43
-
44
 |
 |

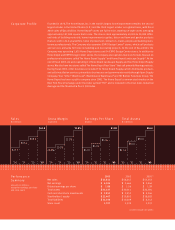
Sales
$ in billions
Gross Margin
in percent
Earnings Per Share
diluted
Total Assets
$ in billions
Corporate Profile Founded in 1978, The Home Depot, Inc. is the world’s largest home improvement retailer, the second
largest retailer in the United States (U.S.) and the third largest retailer on a global basis, with fiscal
2003 sales of $64.8 billion. Home Depot®stores are full-service, warehouse-style stores averaging
approximately 107,000 square feet in size. The stores stock approximately 40,000 to 50,000 differ-
ent kinds of building materials, home improvement supplies, décor and lawn and garden products
that are sold to do-it-yourselfers, home improvement contractors, trades people and building main-
tenance professionals. The Company also operates EXPO Design Center®stores, which sell products
and services primarily for home remodeling and decorating projects. At the end of fiscal 2003, the
Company was operating 1,635 Home Depot stores and 54 EXPO Design Center stores. In addition to
Home Depot and EXPO Design Center stores, the Company also operates two store formats focused on
professional customers called The Home Depot SupplySM and Home Depot Landscape SupplySM. At the
end of fiscal 2003, we were operating 11 Home Depot Landscape Supply and five Home Depot Supply
stores. We also have two stores called The Home Depot Floor StoreSM that sell primarily flooring products.
During fiscal 2003, other businesses included The Home Depot Supply, which distributes products
and sells installation services primarily to businesses and governments mainly through Apex Supply
Company, Your “other” Warehouse®, Maintenance Warehouse®and HD Builder Solutions Group. The
Home Depot has been a public company since 1981. The Home Depot’s common stock trades on the
New York Stock Exchange under the ticker symbol “HD” and is included in the Dow Jones Industrial
Average and the Standard & Poor’s 500 Index.
Performance
Summary
amounts in millions,
except for earnings per share
and store count
2003 2002 2001(1)
Net sales $ 64,816 $58,247 $53,553
Net earnings $ 4,304 $3,664 $3,044
Diluted earnings per share $ 1.88 $1.56 $1.29
Total assets $ 34,437 $30,011 $26,394
Cash and short-term investments $ 2,852 $2,253 $2,546
Stockholders’ equity $ 22,407 $19,802 $18,082
Total liabilities $ 12,030 $10,209 $8,312
Store count 1,707 1,532 1,333
(1) 2001 includes 53 weeks
$64.8
$58.2
$53.6
$45.7
’00 ’01 ’02 ’03
31.8%
31.1%
30.2%
29.9%
’00 ’01 ’02 ’03
$1.88
$1.56
$1.29
$1.10
’00 ’01 ’02 ’03
$34.4
$30.0
$26.4
$21.4
’00 ’01 ’02 ’03