Home Depot 2003 Annual Report Download - page 27
Download and view the complete annual report
Please find page 27 of the 2003 Home Depot annual report below. You can navigate through the pages in the report by either clicking on the pages listed below, or by using the keyword search tool below to find specific information within the annual report.-
 1
1 -
2
-
3
-
4
-
5
-
6
-
7
-
8
-
9
-
10
-
11
-
12
-
13
-
14
-
15
-
16
-
 17
17 -
 18
18 -
 19
19 -
 20
20 -
 21
21 -
 22
22 -
 23
23 -
 24
24 -
 25
25 -
 26
26 -
 27
27 -
 28
28 -
 29
29 -
 30
30 -
 31
31 -
 32
32 -
 33
33 -
 34
34 -
 35
35 -
 36
36 -
 37
37 -
38
-
39
-
40
-
41
-
42
-
43
-
44
 |
 |

The Home Depot, Inc. | 25
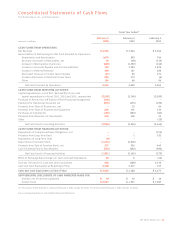
Consolidated Statements of Cash Flows
The Home Depot, Inc. and Subsidiaries
Fiscal Year Ended(1)
February 1,February 2, February 3,
amounts in millions 2004 2003 2002
CASH FLOWS FROM OPERATIONS:
Net Earnings $ 4,304 $ 3,664 $ 3,044
Reconciliation of Net Earnings to Net Cash Provided by Operations:
Depreciation and Amortization 1,076 903 764
Decrease (Increase) in Receivables, net 25 (38) (119)
Increase in Merchandise Inventories (693) (1,592) (166)
Increase in Accounts Payable and Accrued Liabilities 790 1,394 1,878
Increase in Deferred Revenue 279 147 200
(Decrease) Increase in Income Taxes Payable (27) 83 272
Increase (Decrease) in Deferred Income Taxes 605 173 (6)
Other 186 68 96
Net Cash Provided by Operations 6,545 4,802 5,963
CASH FLOWS FROM INVESTING ACTIVITIES:
Capital Expenditures, net of $47, $49 and $5of non-cash
capital expenditures in fiscal 2003, 2002 and 2001, respectively (3,508) (2,749) (3,393)
Purchase of Assets from Off-Balance Sheet Financing Arrangement (598) ––
Payments for Businesses Acquired, net (215) (235) (190)
Proceeds from Sales of Businesses, net –22 64
Proceeds from Sales of Property and Equipment 265 105 126
Purchases of Investments (159) (583) (85)
Proceeds from Maturities of Investments 219 506 25
Other –– (13)
Net Cash Used in Investing Activities (3,996) (2,934) (3,466)
CASH FLOWS FROM FINANCING ACTIVITIES:
Repayments of Commercial Paper Obligations, net –– (754)
Proceeds from Long-Term Debt –1 532
Repayments of Long-Term Debt (9) ––
Repurchase of Common Stock (1,554) (2,000) –
Proceeds from Sale of Common Stock, net 227 326 445
Cash Dividends Paid to Stockholders (595) (492) (396)
Net Cash Used in Financing Activities (1,931) (2,165) (173)
Effect of Exchange Rate Changes on Cash and Cash Equivalents 20 8 (14)
Increase (Decrease) in Cash and Cash Equivalents 638 (289) 2,310
Cash and Cash Equivalents at Beginning of Year 2,188 2,477 167
Cash and Cash Equivalents at End of Year $ 2,826 $ 2,188 $ 2,477
SUPPLEMENTAL DISCLOSURE OF CASH PAYMENTS MADE FOR:
Interest, net of interest capitalized $70 $50 $18
Income Taxes $ 2,037 $ 1,951 $ 1,685
(1) Fiscal years ended February 1, 2004 and February 2, 2003 include 52 weeks. Fiscal year ended February 3, 2002 includes 53 weeks.
See accompanying Notes to Consolidated Financial Statements.