Home Depot 2003 Annual Report Download - page 17
Download and view the complete annual report
Please find page 17 of the 2003 Home Depot annual report below. You can navigate through the pages in the report by either clicking on the pages listed below, or by using the keyword search tool below to find specific information within the annual report.-
 1
1 -
2
-
3
-
4
-
5
-
6
-
 7
7 -
 8
8 -
 9
9 -
 10
10 -
 11
11 -
 12
12 -
 13
13 -
 14
14 -
 15
15 -
 16
16 -
 17
17 -
 18
18 -
 19
19 -
 20
20 -
 21
21 -
 22
22 -
 23
23 -
 24
24 -
 25
25 -
 26
26 -
 27
27 -
28
-
29
-
30
-
31
-
32
-
33
-
34
-
35
-
36
-
37
-
38
-
39
-
40
-
41
-
42
-
43
-
44
 |
 |
The Home Depot, Inc. | 15
Management’s Discussion and Analysis of
Results of Operations and Financial Condition (continued)
The Home Depot, Inc. and Subsidiaries
FORWARD-LOOKING STATEMENTS
Certain statements of The Home Depot’s expectations herein,
including, but not limited to statements regarding Net Sales
growth, new stores, increases in comparable store sales, com-
modity price inflation and deflation, impact of cannibalization,
increases in net service revenues, implementation of store
initiatives, Net Earnings performance, the effect of adopting cer-
tain accounting standards and Capital Expenditures constitute
“forward-looking statements” as defined in the Private Securities
Litigation Reform Act of 1995. Such statements are based on cur-
rently available operating, financial and competitive information
and are subject to various risks and uncertainties that could
cause actual results to differ materially from our historical experi-
ence and our present expectations. These risks and uncertainties
include but are not limited to, fluctuations in and the overall
condition of the U.S. economy, stability of costs and availability of
sourcing channels, conditions affecting new store development,
our ability to implement new technologies and processes, our
ability to attract, train, and retain highly-qualified associates,
unanticipated weather conditions and the impact of competition
and regulatory and litigation matters. Undue reliance should not
be placed on such forward-looking statements, as such statements
speak only as of the date on which they are made. Additional
information regarding these and other risks is contained in our
periodic filings with the Securities and Exchange Commission.
RESULTS OF OPERATIONS
For an understanding of the significant factors that influenced our
performance during the past three fiscal years, the following dis-
cussion should be read in conjunction with the Consolidated
Financial Statements and the Notes to Consolidated Financial
Statements presented in this Annual Report.
Fiscal 2003 Compared to Fiscal 2002
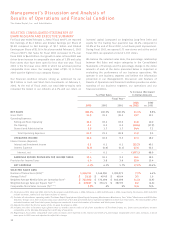
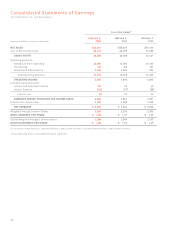
Net Sales for fiscal 2003 increased 11.3% to $64.8 billion from
$58.2 billion in fiscal 2002. Fiscal 2003 Net Sales growth was
driven by an increase in comparable store sales of 3.8%, sales
from the 175 new stores opened during fiscal 2003 and sales from
the 203 new stores opened during fiscal 2002. We plan to open
175 new stores during the fiscal year ending January 30, 2005
(“fiscal 2004”). We expect Net Sales growth of 9% to 12% for
fiscal 2004 driven by comparable store sales, the planned addi-
tion of 175 new stores and sales from the 175 stores opened
during fiscal 2003.
The increase in comparable store sales in fiscal 2003 reflects a
number of factors. Comparable store sales in fiscal 2003 were
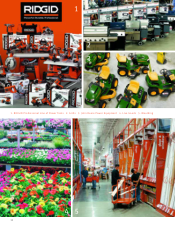
positive in 10 of the 11 selling departments. Our lawn and garden
category was the biggest driver of the increase in comparable
store sales for fiscal 2003, reflecting strong sales in outdoor
power equipment, including John Deere®tractors and walk-behind
mowers, as well as snow throwers and snow blowers. Lumber was
another strong category during fiscal 2003, driven primarily by
commodity price inflation. Additionally, we had strong sales growth
in our kitchen and bath categories and in our paint department
reflecting the positive impact of new merchandising initiatives.
During fiscal 2003, we added our Appliance initiative to 826 of
our stores bringing the total number of stores with our Appliance
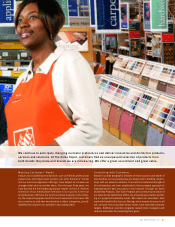
initiative to 1,569 as of the end of fiscal 2003. Additionally, dur-
ing fiscal 2003, each store was set with our new Color Solutions
Center, which drove sales growth in interior and exterior paint, as
well as pressure washers. Finally, our comparable store sales
growth in fiscal 2003 reflects the impact of cannibalization.
In order to meet our customer service objectives, we strategically
open stores near market areas served by existing stores (“canni-
balize”) to enhance service levels, gain incremental sales and
increase market penetration. As of the end of fiscal 2003, certain
new stores cannibalized approximately 17% of our existing stores
and we estimate that store cannibalization reduced fiscal 2003
comparable store sales by approximately 2.7%. Additionally, we
believe that our sales performance has been, and could continue
to be, negatively impacted by the level of competition that we
encounter in various markets. However, due to the highly-
fragmented U.S. home improvement industry, in which we
estimate our market share is approximately 11%, measuring the
impact on our sales by our competitors is extremely difficult.
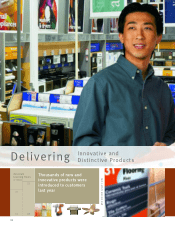
Comparable store sales in fiscal 2004 are expected to increase
3% to 6%. We expect our comparable store sales to be favorably
impacted by the introduction of innovative new and distinctive
merchandise as well as positive customer reaction to our store
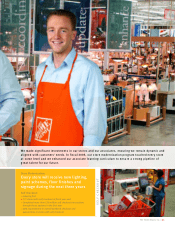
modernization program. Our store modernization program, which
includes merchandising resets, complete store remodels and new
signing, lighting and flooring packages, is enhancing our cus-
tomers’ shopping experience. We do not believe that changing
prices for commodities will have a material effect on Net Sales or
results of operations in fiscal 2004. Our projected fiscal 2004
comparable store sales increase reflects our projected impact of
cannibalization of approximately 2%.
The growth in Net Sales for fiscal 2003 reflects growth in net
service revenues, which increased 40% to $2.8 billion in fiscal
2003 from $2.0 billion in fiscal 2002, driven by strength in a
number of areas including countertops, HVAC, kitchens and our
flooring companies. We continued to drive our services programs,
which focus primarily on providing products and services to our
do-it-for-me customers. These programs are offered through Home
Depot and EXPO Design Center stores. We also arrange for the
provision of flooring installation services to homebuilders
through HD Builder Solutions Group, Inc.
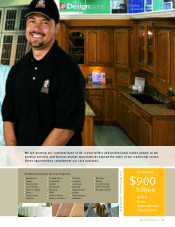
We are building on the natural adjacencies in the home
improvement business to extend and expand our market opportu-
nities in our services businesses. Our services businesses are
expected to benefit from the growing percentage of mature
customers as they rely much more heavily on installation services.
During fiscal 2003, we continued the implementation or
expansion of a number of in-store initiatives. We believe these
initiatives will enhance our customers’ shopping experience as
they are fully implemented in our stores. The professional