Home Depot 2003 Annual Report Download - page 19
Download and view the complete annual report
Please find page 19 of the 2003 Home Depot annual report below. You can navigate through the pages in the report by either clicking on the pages listed below, or by using the keyword search tool below to find specific information within the annual report.-
 1
1 -
2
-
3
-
4
-
5
-
6
-
7
-
8
-
 9
9 -
 10
10 -
 11
11 -
 12
12 -
 13
13 -
 14
14 -
 15
15 -
 16
16 -
 17
17 -
 18
18 -
 19
19 -
 20
20 -
 21
21 -
 22
22 -
 23
23 -
 24
24 -
 25
25 -
 26
26 -
 27
27 -
 28
28 -
 29
29 -
30
-
31
-
32
-
33
-
34
-
35
-
36
-
37
-
38
-
39
-
40
-
41
-
42
-
43
-
44
 |
 |
The Home Depot, Inc. | 17
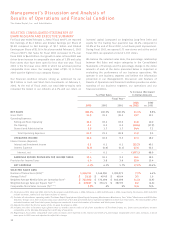
Management’s Discussion and Analysis of
Results of Operations and Financial Condition (continued)
The Home Depot, Inc. and Subsidiaries
Fiscal 2002 Compared to Fiscal Year Ended
February 3, 2002 (“Fiscal 2001”)
Fiscal 2002 included 52 weeks as compared to 53 weeks in fiscal
2001. Net Sales for fiscal 2002 increased 8.8% to $58.2 billion
from $53.6 billion in fiscal 2001. This increase was attributable to
the 203 new stores opened during fiscal 2002 and full year sales
from the 204 new stores opened during fiscal 2001. The increase
was partially offset by the Net Sales attributable to the additional
week in fiscal 2001 of $880 million.
Comparable store sales were flat in fiscal 2002, reflecting a
number of internal and external factors. In the spring and early
summer, we experienced some inventory out-of-stock positions
as we transitioned through our in-store Service Performance
Improvement initiative, in which our stores handle and receive
inventory at night. In addition, comparable store sales were neg-
atively impacted by the level of merchandise resets implemented
throughout the year, which disrupted in-store service and had a
negative impact on the customers’ experience in our stores.
Kitchen and bath, plumbing and paint categories experienced
strong comparable store sales growth for the year, which offset
price deflation and the resulting comparable store sales decline
in commodity categories such as lumber. During fiscal 2002, com-
parable store sales increased in the appliance category by
approximately 23%. Net service revenues for fiscal 2002
increased 25% to $2.0 billion from $1.6 billion in fiscal 2001.
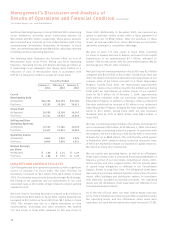
As of the end of fiscal 2002, certain new stores cannibalized
approximately 21% of our existing stores and we estimate that
store cannibalization reduced total comparable store sales by
approximately 4%, or about the same percentage as in the prior
year. As we heavily cannibalized our most productive divisions,
the weighted average weekly sales per store decreased during
fiscal 2002 to $772,000 from $812,000 in the prior year.
Gross Profit increased 12.1% to $18.1 billion for fiscal 2002 from
$16.1 billion for fiscal 2001. Gross Profit as a percent of Net Sales
was 31.1% for fiscal 2002 compared to 30.2% for fiscal 2001. The
increase in the gross profit rate was attributable to a reduction in
the Cost of Merchandise Sold, which resulted from centralized
purchasing, as we continued rationalizing vendor and SKU
assortments. Enhanced inventory control, which resulted in lower
shrink levels, and an increase in direct import penetration to
8% in fiscal 2002 from 6% in fiscal 2001 also positively impacted
the gross profit rate.
Operating Expenses increased 9.5% to $12.3 billion for fiscal
2002 from $11.2 billion for fiscal 2001. Operating Expenses as a
percent of Net Sales were 21.1% for fiscal 2002 compared to
20.9% for fiscal 2001.
Selling and Store Operating Expenses, which are included in
Operating Expenses, increased 10.0% to $11.2 billion for fiscal
2002 from $10.2 billion for fiscal 2001. As a percent of Net Sales,
Selling and Store Operating Expenses increased to 19.2% in fiscal
2002 from 19.0% in fiscal 2001. The increase in Selling and Store
Operating Expenses was primarily attributable to higher costs
associated with merchandise resets and store renovations as we
invested in new signing, fixtures and general maintenance of our
stores, a continued investment in store leadership positions in
our stores and rising workers’ compensation expense due in part
to medical cost inflation. These increases were partially offset by
a decrease in store payroll expense which resulted from improve-
ment in labor productivity and effective wage rate management.
Our combined federal and state effective income tax rate
decreased to 37.6% for fiscal 2002 from 38.6% for fiscal 2001.
The decrease in fiscal 2002 was attributable to higher tax
credits and a lower effective state income tax rate compared to
fiscal 2001.
ADOPTION OF EITF 02-16
In fiscal 2003, we adopted EITF 02-16, “Accounting by a Customer
(Including a Reseller) for Certain Consideration Received from
a Vendor,” which states that cash consideration received from a
vendor is presumed to be a reduction of the prices of the vendor’s
products or services and should, therefore, be characterized as a
reduction of Cost of Merchandise Sold when recognized in our
Consolidated Statements of Earnings. That presumption is over-
come when the consideration is either a reimbursement of specific,
incremental and identifiable costs incurred to sell the vendor’s
products or a payment for assets or services delivered to the
vendor. We received consideration in the form of advertising co-op
allowances from our vendors pursuant to annual agreements,
which are generally on a calendar year basis. As permitted by
EITF 02-16, we elected to apply its provisions prospectively to all
agreements entered into or modified after December 31, 2002.
Therefore, the impact for us of adopting EITF 02-16 in fiscal
2003 was limited to advertising co-op allowances earned
pursuant to vendor agreements entered into in late 2003, which
became effective in January 2004.
The one-month impact of EITF 02-16 in fiscal 2003 resulted in a
reduction of Cost of Merchandise Sold of $40 million, an increase
in Selling and Store Operating Expenses of $47 million and
a reduction of Earnings before Provision for Income Taxes of
$7million. The impact on our Diluted Earnings per Share was
immaterial. Merchandise Inventories in our accompanying
Consolidated Balance Sheets were also reduced by $7million.
We estimate that the impact of EITF 02-16 in fiscal 2004 will be a
reduction of Cost of Merchandise Sold of $820 million, an
increase in Selling and Store Operating Expenses of $1.0 billion
and a reduction of Earnings before Provision for Income Taxes of
$180 million. The impact on our Diluted Earnings per Share is
estimated to be $0.05. Merchandise Inventories are also estimat-
ed to be reduced by $180 million.
Prior to the adoption of EITF 02-16 in fiscal 2003, the entire
amount of advertising co-op allowances received was offset
against advertising expense and resulted in a reduction of Selling