Home Depot 2003 Annual Report Download - page 26
Download and view the complete annual report
Please find page 26 of the 2003 Home Depot annual report below. You can navigate through the pages in the report by either clicking on the pages listed below, or by using the keyword search tool below to find specific information within the annual report.-
 1
1 -
2
-
3
-
4
-
5
-
6
-
7
-
8
-
9
-
10
-
11
-
12
-
13
-
14
-
15
-
 16
16 -
 17
17 -
 18
18 -
 19
19 -
 20
20 -
 21
21 -
 22
22 -
 23
23 -
 24
24 -
 25
25 -
 26
26 -
 27
27 -
 28
28 -
 29
29 -
 30
30 -
 31
31 -
 32
32 -
 33
33 -
 34
34 -
 35
35 -
 36
36 -
37
-
38
-
39
-
40
-
41
-
42
-
43
-
44
 |
 |

Accumulated
Other Total
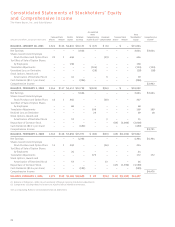
Common Stock Paid-In Retained Comprehensive Unearned Treasury Stock Stockholders’ Comprehensive
amounts in millions, except per share data Shares Amount Capital Earnings Income (Loss)(1)Compensation Shares Amount Equity Income(2)
BALANCE, JANUARY 28, 2001 2,324 $116 $4,810 $10,151 $ (67) $ (6) – $ – $15,004
Net Earnings – – – 3,044 – – – – 3,044 $3,044
Shares Issued Under Employee
Stock Purchase and Option Plans 22 1 448 – – (23) – – 426
Tax Effect of Sale of Option Shares
by Employees – – 138 – – – – – 138
Translation Adjustments – – – – (124) – – – (124) (124)
Unrealized Loss on Derivative – – – – (29) – – – (29) (18)
Stock Options, Awards and
Amortization of Restricted Stock ––16 – – 3– – 19
Cash Dividends ($0.17 per share) – – – (396) – – – – (396)
Comprehensive Income $2,902
BALANCE, FEBRUARY 3, 2002 2,346 $117 $5,412 $12,799 $(220) $(26) – $ – $18,082
Net Earnings – – – 3,664 – – – – 3,664 $3,664
Shares Issued Under Employee
Stock Purchase and Option Plans 16 1 366 – – (40) – – 327
Tax Effect of Sale of Option Shares
by Employees ––68 – – –– – 68
Translation Adjustments – – – – 109 – – – 109 109
Realized Loss on Derivative ––– – 29 –– – 29 18
Stock Options, Awards and
Amortization of Restricted Stock ––12 – – 3– – 15
Repurchase of Common Stock – – – – – – (69) (2,000) (2,000)
Cash Dividends ($0.21 per share) – – – (492) – – – – (492)
Comprehensive Income $3,791
BALANCE, FEBRUARY 2, 2003 2,362 $118 $5,858 $15,971 $ (82) $(63) (69) $(2,000) $19,802
Net Earnings – – – 4,304 – – – – 4,304 $4,304
Shares Issued Under Employee
Stock Purchase and Option Plans 11 1 249 – – (26) – – 224
Tax Effect of Sale of Option Shares
by Employees ––24 – – –– – 24
Translation Adjustments – – – – 172 – – – 172 172
Stock Options, Awards and
Amortization of Restricted Stock – – 53 – – 13 – – 66
Repurchase of Common Stock – – – – – – (47) (1,590) (1,590)
Cash Dividends ($0.26 per share) – – – (595) – – – – (595)
Comprehensive Income $4,476
BALANCE, FEBRUARY 1, 2004 2,373 $119 $6,184 $19,680 $ 90 $(76) (116) $(3,590) $22,407
(1) Balance at February 1, 2004 consists primarily of foreign currency translation adjustments.
(2) Components of Comprehensive Income are reported net of related income taxes.
See accompanying Notes to Consolidated Financial Statements.
Consolidated Statements of Stockholders’ Equity
and Comprehensive Income
The Home Depot, Inc. and Subsidiaries
24