Home Depot 2001 Annual Report Download - page 38
Download and view the complete annual report
Please find page 38 of the 2001 Home Depot annual report below. You can navigate through the pages in the report by either clicking on the pages listed below, or by using the keyword search tool below to find specific information within the annual report.-
 1
1 -
2
-
3
-
4
-
5
-
6
-
7
-
8
-
9
-
10
-
11
-
12
-
13
-
14
-
15
-
16
-
17
-
18
-
19
-
20
-
21
-
22
-
23
-
24
-
25
-
26
-
27
-
 28
28 -
 29
29 -
 30
30 -
 31
31 -
 32
32 -
 33
33 -
 34
34 -
 35
35 -
 36
36 -
 37
37 -
 38
38 -
 39
39 -
 40
40 -
 41
41 -
 42
42
 |
 |
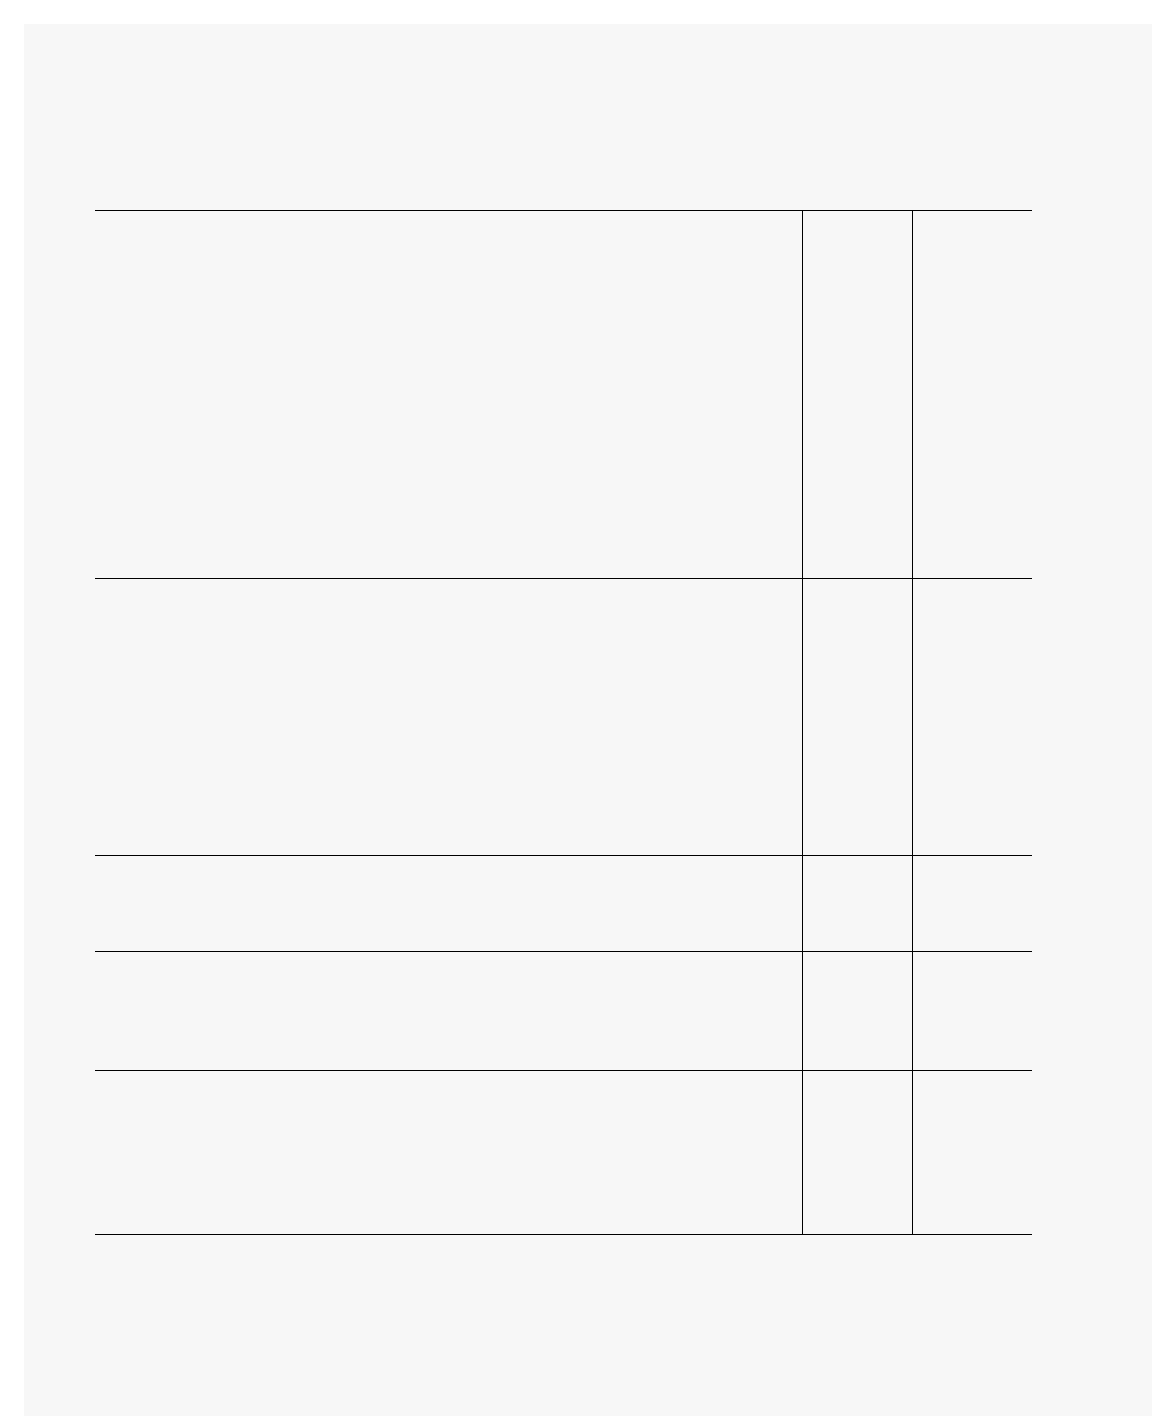
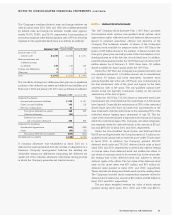
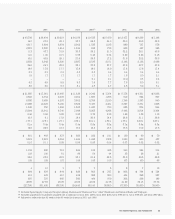
10-YEAR SUMMARY OF FINANCIAL AND OPERATING RESULTS
The Home Depot, Inc. and Subsidiaries36
5 -Year 10 -Year
Compound Annual Compound Annual
amounts in millions, except where noted Growth Rate Growth Rate 2001(1)
STATEMENT OF EARNINGS DATA
Net sales 22.3% 26.4% $ 53,553
Net sales increase (%) ––17.1
Earnings before income taxes(2) 26.4 28.8 4,957
Net earnings(2) 26.5 28.4 3,044
Net earnings increase (%)(2) – – 17.9
Diluted earnings per share ($)(2,3) 24.6 25.8 1.29
Diluted earnings per share increase (%)(2) – – 17.3
Weighted average number of common shares outstanding assuming dilution 1.4 1.7 2,353
Gross margin – % of sales – – 30.2
Store selling and operating expense – % of sales – – 19.0
Pre-opening expense – % of sales – – 0.2
General and administrative expense – % of sales – – 1.7
Net interest income (expense) – % of sales – – –
Earnings before income taxes – % of sales(2) – – 9.3
Net earnings – % of sales(2) – – 5.7
BALANCE SHEET DATA AND FINANCIAL RATIOS
Total assets 23.1% 26.5% $ 26,394
Working capital 15.6 20.0 3,860
Merchandise inventories 20.0 26.1 6,725
Net property and equipment 23.1 28.5 15,375
Long-term debt 0.1 16.5 1,250
Stockholders’equity 24.9 26.7 18,082
Book value per share ($) 22.9 24.1 7.71
Long-term debt to equity (%) – – 6.9
Current ratio – – 1.59:1
Inventory turnover – – 5.4x
Return on invested capital (%)(2) – – 18.3
STATEMENT OF CASH FLOWS DATA
Depreciation and amortization 26.9% 30.8% $ 764
Capital expenditures(5) 22.2 22.9 3,398
Cash dividends per share ($) 27.7 32.8 0.17
STORE DATA(4)
Number of stores 21.1% 22.6% 1,333
Square footage at year-end 22.0 24.7 146
Increase in square footage (%) – – 18.5
Average square footage per store (in thousands) 0.8 1.4 109
STORE SALES AND OTHER DATA
Comparable store sales increase (%)(6) – – –
Weighted average weekly sales per operating store (in thousands)(4) 0.2% 2.5% $ 812
Weighted average sales per square foot ($)(4,6) (0.5) 1.1 388
Number of customer transactions(4) 18.6 22.3 1,091
Average sale per transaction ($)(4) 2.9 3.3 48.64
Number of associates at year-end (actual) 21.2 24.8 256,300
(1) Fiscal years 2001 and 1996 consisted of 53 weeks; all other fiscal years reported consisted of 52 weeks.
(2) Excludes the effect of a $104 million non-recurring charge in fiscal 1997.
(3) Diluted earnings per share for fiscal 1997, including a $104 million non-recurring charge, were $0.52.