Home Depot 2001 Annual Report Download - page 36
Download and view the complete annual report
Please find page 36 of the 2001 Home Depot annual report below. You can navigate through the pages in the report by either clicking on the pages listed below, or by using the keyword search tool below to find specific information within the annual report.-
 1
1 -
2
-
3
-
4
-
5
-
6
-
7
-
8
-
9
-
10
-
11
-
12
-
13
-
14
-
15
-
16
-
17
-
18
-
19
-
20
-
21
-
22
-
23
-
24
-
25
-
 26
26 -
 27
27 -
 28
28 -
 29
29 -
 30
30 -
 31
31 -
 32
32 -
 33
33 -
 34
34 -
 35
35 -
 36
36 -
 37
37 -
 38
38 -
 39
39 -
 40
40 -
 41
41 -
 42
42
 |
 |
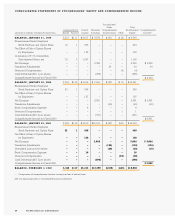
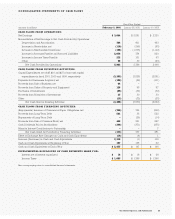
NOTES TO CONSOLIDATED FINANCIAL STATEMENTS (CONTINUED)
The Home Depot, Inc. and Subsidiaries34
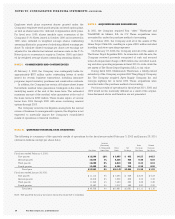
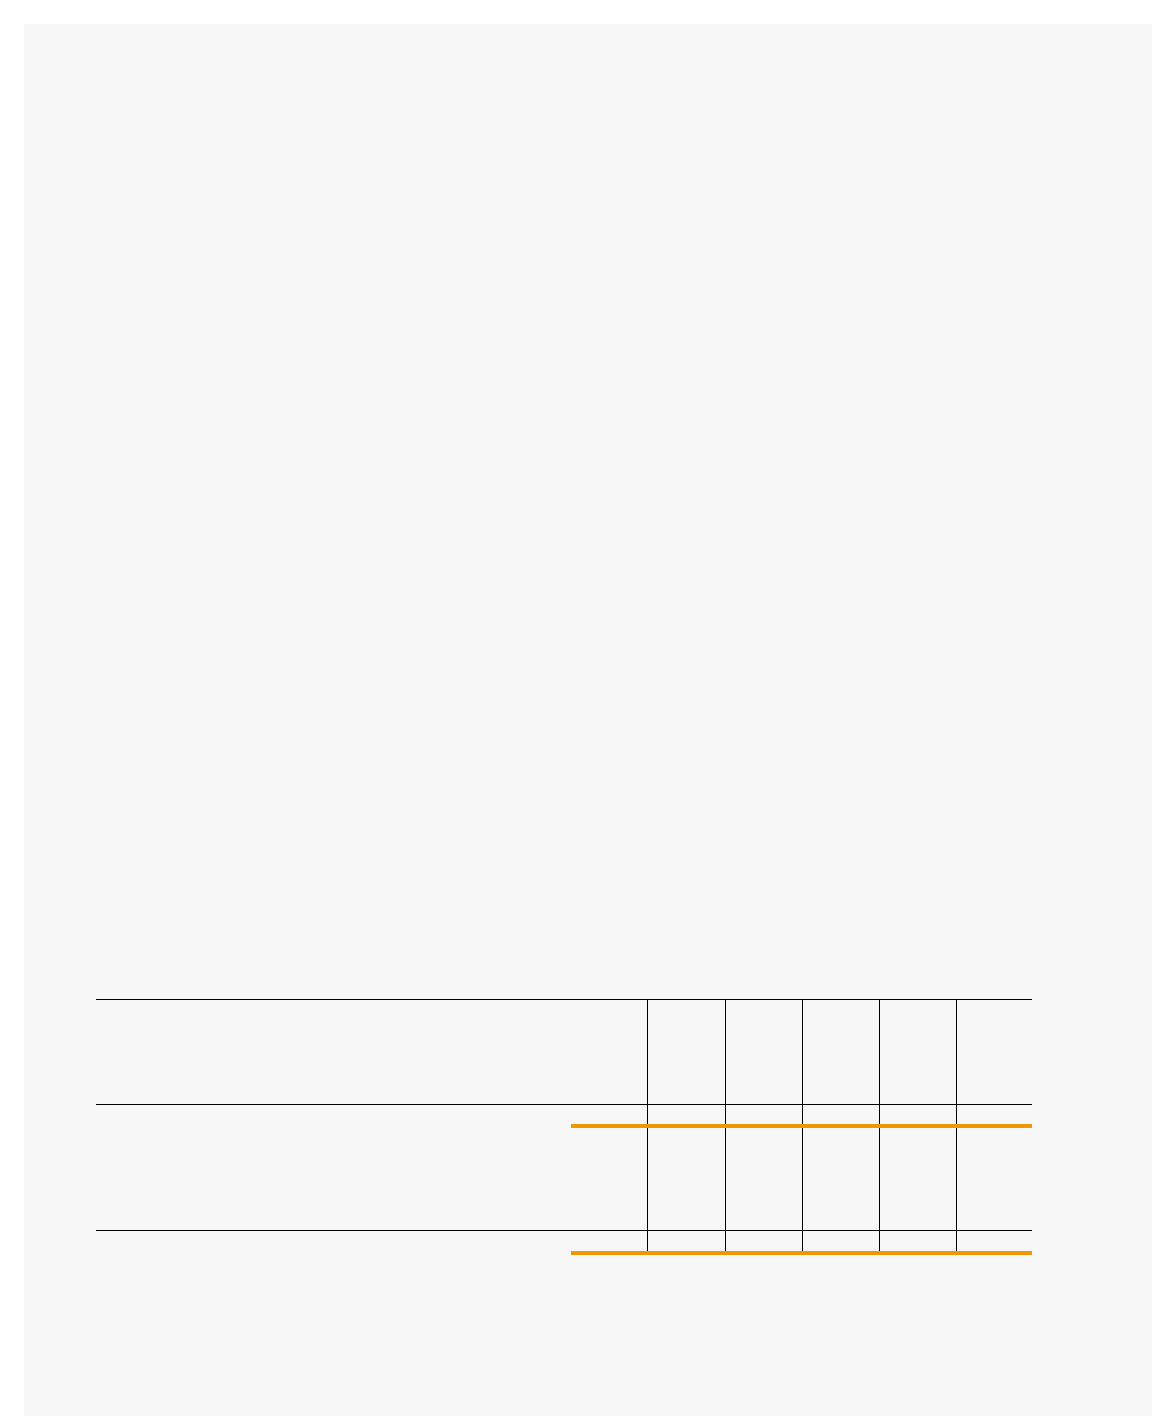
NOTE 10. QUARTERLY FINANCIAL DATA (UNAUDITED)
The following is a summary of the quarterly results of operations for the fiscal years ended February 3, 2002 and January 28, 2001
(dollars in millions, except per share data):
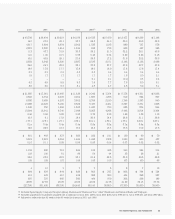
Employee stock plans represent shares granted under the
Company’s employee stock purchase plan and stock option plans,
as well as shares issued for deferred compensation stock plans.
For fiscal year 1999, shares issuable upon conversion of the
Company’s 31/4% Notes, issued in October 1996 and converted in
1999, were included in weighted average shares outstanding
assuming dilution for purposes of calculating diluted earnings per
share. To calculate diluted earnings per share, net earnings are
adjusted for tax-effected net interest and issue costs on the 31/4%
Notes (prior to conversion to equity in October 1999) and divid-
ed by weighted average shares outstanding assuming dilution.
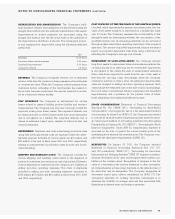
NOTE 8. COMMITMENTS AND CONTINGENCIES
At February 3, 2002, the Company was contingently liable for
approximately $557 million under outstanding letters of credit
issued for certain business transactions, including insurance
programs, import inventory purchases and construction contracts.
In addition, the Company has certain off-balance sheet leases
that include residual value guarantees contingent on the value of
underlying assets at the end of the lease term. The estimated
maximum amount of the residual value guarantees at the end of
the lease terms is $799 million. These leases expire at various
terms from 2004 through 2008 with some containing renewal
options through 2025.
The Company is involved in litigation arising from the normal
course of business. In management’s opinion, this litigation is not
expected to materially impact the Company’s consolidated
results of operations or financial condition.
NOTE 9. ACQUISITIONS AND DISPOSITIONS
In 2001, the Company acquired Your “other”Warehouse and
TotalHOME de Mexico, S.A. de C.V. These acquisitions were
accounted for under the purchase method of accounting.
In October 2001, the Company sold all of the assets of The
Home Depot Chile S.A., resulting in a gain of $31 million included
in selling and store operating expenses.
On February 18, 2002, the Company sold all of the assets of
The Home Depot Argentina S.R.L. In connection with the sale, the
Company received proceeds comprised of cash and secured
notes. An impairment charge of $45 million was recorded in sell-
ing and store operating expenses in fiscal 2001 to write down the
net assets of The Home Depot Argentina S.R.L. to fair value.
During fiscal 2000, Maintenance Warehouse, a wholly-owned
subsidiary of the Company, acquired N-E Thing Supply Company,
Inc. The Company acquired Apex Supply Company, Inc. and
Georgia Lighting, Inc. in fiscal 1999. These acquisitions were
recorded under the purchase method of accounting.
Pro forma results of operations for fiscal years 2001, 2000 and
1999 would not be materially different as a result of the acquisi-
tions discussed above and therefore are not presented.
Increase
(Decrease) Basic Diluted
In Comparable Gross Net Earnings Earnings
Net Sales Store Sales Profit Earnings Per Share Per Share
Fiscal year ended February 3, 2002:
First quarter $ 12,200 (3)% $ 3,655 $ 632 $0.27 $ 0.27
Second quarter 14,576 1% 4,326 924 0.40 0.39
Third quarter 13,289 0% 4,010 778 0.33 0.33
Fourth quarter 13,488 5% 4,156 710 0.30 0.30
Fiscal year $ 53,553 0% $16,147 $3,044 $1.30 $ 1.29
Fiscal year ended January 28, 2001:
First quarter $ 11,112 7% $ 3,274 $ 629 $ 0.27 $ 0.27
Second quarter 12,618 6% 3,739 838 0.36 0.36
Third quarter 11,545 4% 3,450 650 0.28 0.28
Fourth quarter 10,463 0% 3,217 465 0.20 0.20
Fiscal year $ 45,738 4% $13,681 $ 2,581 $ 1.11 $ 1.10
Note: The quarterly data may not sum to fiscal year totals due to rounding.