Home Depot 2001 Annual Report Download - page 34
Download and view the complete annual report
Please find page 34 of the 2001 Home Depot annual report below. You can navigate through the pages in the report by either clicking on the pages listed below, or by using the keyword search tool below to find specific information within the annual report.-
 1
1 -
2
-
3
-
4
-
5
-
6
-
7
-
8
-
9
-
10
-
11
-
12
-
13
-
14
-
15
-
16
-
17
-
18
-
19
-
20
-
21
-
22
-
23
-
 24
24 -
 25
25 -
 26
26 -
 27
27 -
 28
28 -
 29
29 -
 30
30 -
 31
31 -
 32
32 -
 33
33 -
 34
34 -
 35
35 -
 36
36 -
 37
37 -
 38
38 -
 39
39 -
 40
40 -
 41
41 -
 42
42
 |
 |
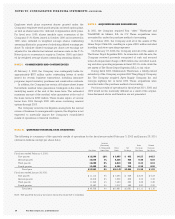
NOTES TO CONSOLIDATED FINANCIAL STATEMENTS (CONTINUED)
The Home Depot, Inc. and Subsidiaries32
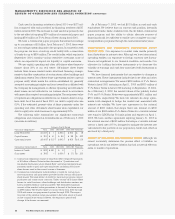
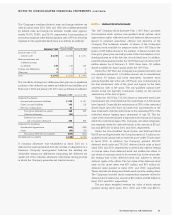
$31.96 and $18.86, respectively. The fair value of these options
was determined at the date of grant using the Black-Scholes
option-pricing model with the following assumptions:
Fiscal Year Ended
February 3, 2002 January 28, 2001 January 30, 2000
Risk-free interest rate 5.1% 6.4% 5.1%
Expected volatility of
common stock 48.1% 54.6% 51.6%
Dividend yield 0.4% 0.3% 0.3%
Expected option term 6 years 7 years 5 years
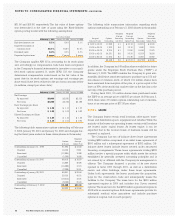
The Company applies APB 25 in accounting for its stock plans
and, accordingly, no compensation costs have been recognized
in the Company’s financial statements for incentive or non-quali-
fied stock options granted. If, under SFAS 123, the Company
determined compensation costs based on the fair value at the
grant date for its stock options, net earnings and earnings per
share would have been reduced to the pro forma amounts below
(in millions, except per share data):
Fiscal Year Ended
February 3, 2002
January 28, 2001 January 30, 2000
Net Earnings
As reported $3,044 $ 2,581 $2,320
Pro forma $2,800 $ 2,364 $2,186
Basic Earnings per Share
As reported $ 1.30 $ 1.11 $ 1.03
Pro forma $ 1.20 $ 1.02 $ 0.97
Diluted Earnings per Share
As reported $ 1.29 $ 1.10 $ 1.00
Pro forma $ 1.19 $ 1.01 $ 0.94
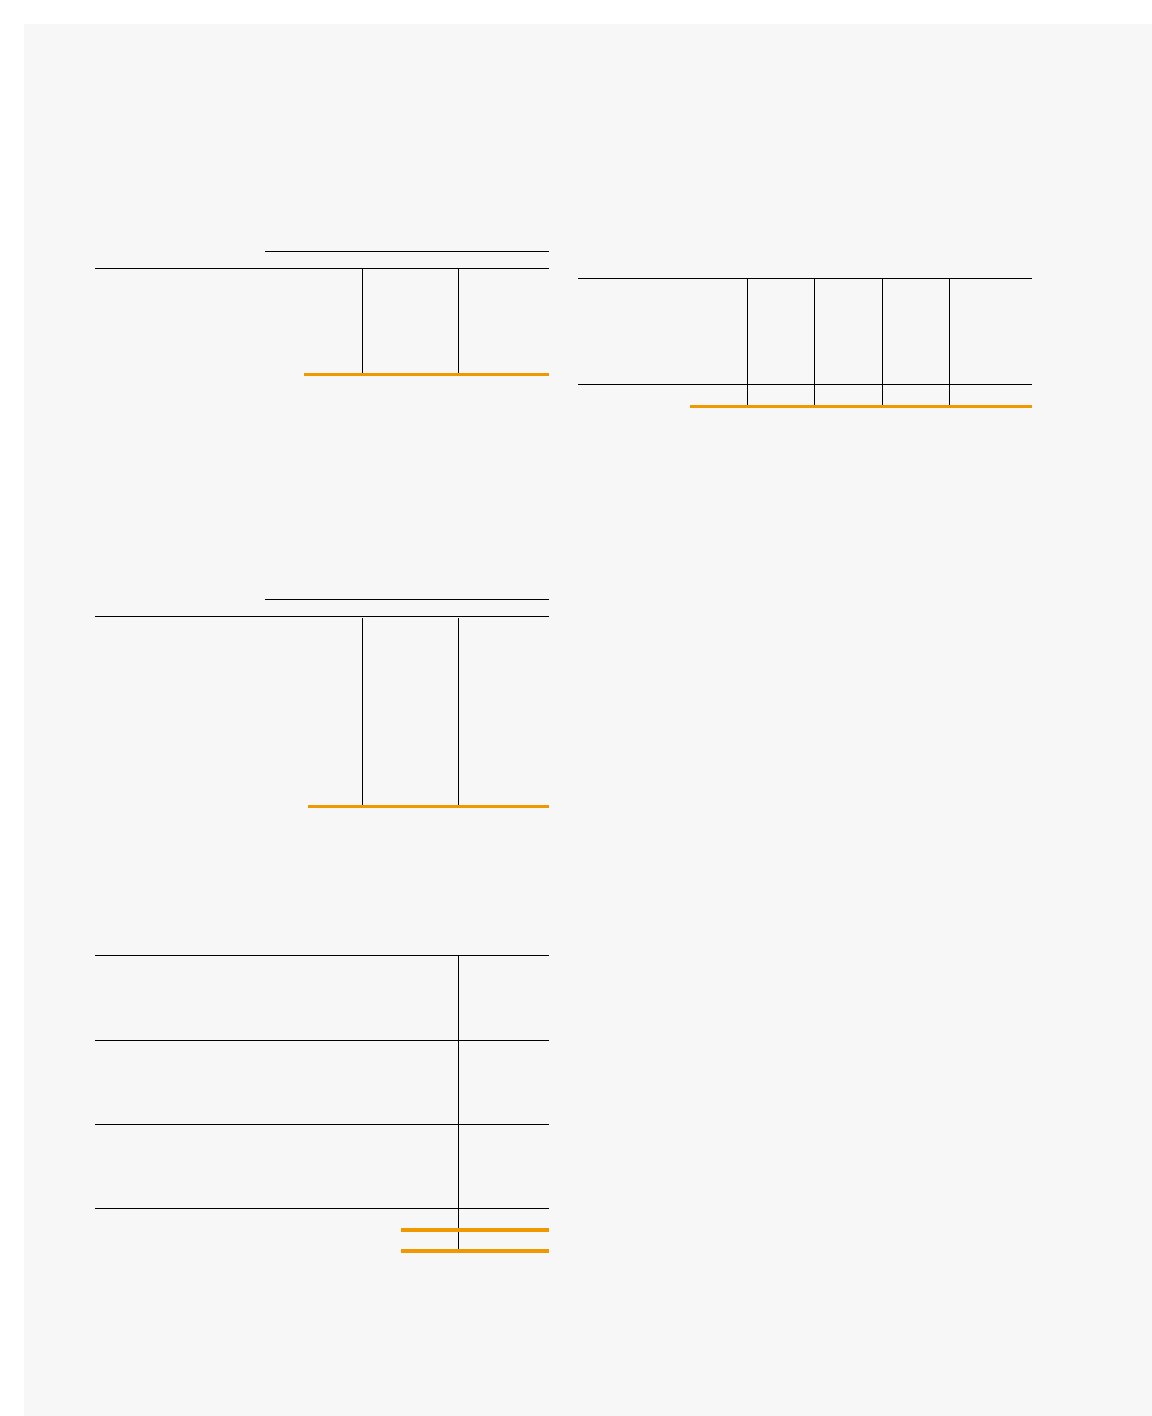
The following table summarizes options outstanding at February
3, 2002, January 28, 2001 and January 30, 2000 and changes dur-
ing the fiscal years ended on these dates (shares in thousands):
Weighted
Number Average
of Shares Option Price
Outstanding at January 31, 1999 71,592 $ 13.45
Granted 14,006 37.81
Exercised (13,884) 10.88
Cancelled (3,295) 18.88
Outstanding at January 30, 2000 68,419 $ 18.79
Granted 14,869 49.78
Exercised (14,689) 13.15
Cancelled (2,798) 30.51
Outstanding at January 28, 2001 65,801 $ 26.46
Granted 25,330 40.33
Exercised (16,614) 15.03
Cancelled (5,069) 39.20
Outstanding at February 3, 2002 69,448 $33.33
Exercisable 26,777 $ 22.68
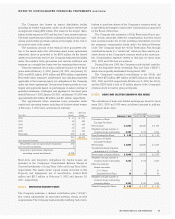
The following table summarizes information regarding stock
options outstanding as of February 3, 2002 (shares in thousands):
Weighted Weighted Weighted
Average Average Average
Range of Options Remaining Outstanding Options Exercisable
Exercise Prices Outstanding Life (Yrs) Option Price Exercisable Option Price
$ 6.00 to 12.00 11,999 4.1 $ 10.10 11,631 $10.00
12.00 to 20.00 1,732 5.6 17.10 1,560 17.30
20.00 to 30.00 9,714 6.1 21.80 5,456 21.70
30.00 to 42.00 34,271 8.8 39.30 6,037 38.90
42.00 to 54.00 11,732 8.3 51.70 2,093 52.80
69,448 7.0 $ 33.33 26,777 $22.68
In addition, the Company had 48 million shares available for future
grants under the Employee Stock Purchase Plan (“ESPP”) at
February 3, 2002. The ESPP enables the Company to grant sub-
stantially all full-time associates options to purchase up to 152 mil-
lion shares of common stock, of which 104 million shares have
been exercised from inception of the plan, at a price equal to the
lower of 85% of the stock’s fair market value on the first day or the
last day of the purchase period.
During fiscal 2001, 5.5 million shares were purchased under
the ESPP at an average price of $35.87 per share. At February 3,
2002, there were 2.8 million options outstanding, net of cancella-
tions, at an average price of $37.26 per share.
NOTE 5. LEASES
The Company leases certain retail locations, office space, ware-
house and distribution space, equipment and vehicles. While the
majority of the leases are operating leases, certain retail locations
are leased under capital leases. As leases expire, it can be
expected that in the normal course of business, leases will be
renewed or replaced.
The Company has two off-balance sheet lease agreements
totaling $882 million comprised of an initial lease agreement of
$600 million and a subsequent agreement of $282 million. Off-
balance sheet leases include leases created under structured
financing arrangements. These lease agreements totaling $882
million involve a special purpose entity which meets the criteria
established by generally accepted accounting principles and is
not owned by or affiliated with the Company, its management or
officers. The Company financed a portion of its new stores
opened in fiscal 1997 through 2001, as well as a distribution
center and office buildings, under these lease agreements.
Under both agreements, the lessor purchases the properties,
pays for the construction costs and subsequently leases the
facilities to the Company. The lease term for the $600 million
agreement expires in 2004 and includes four 2-year renewal
options. The lease term for the $282 million agreement expires in
2008 with no renewal options. Both lease agreements provide for
substantial residual value guarantees and include purchase
options at original cost on each property.