Home Depot 2001 Annual Report Download - page 22
Download and view the complete annual report
Please find page 22 of the 2001 Home Depot annual report below. You can navigate through the pages in the report by either clicking on the pages listed below, or by using the keyword search tool below to find specific information within the annual report.-
 1
1 -
2
-
3
-
4
-
5
-
6
-
7
-
8
-
9
-
10
-
11
-
 12
12 -
 13
13 -
 14
14 -
 15
15 -
 16
16 -
 17
17 -
 18
18 -
 19
19 -
 20
20 -
 21
21 -
 22
22 -
 23
23 -
 24
24 -
 25
25 -
 26
26 -
 27
27 -
 28
28 -
 29
29 -
 30
30 -
 31
31 -
 32
32 -
33
-
34
-
35
-
36
-
37
-
38
-
39
-
40
-
41
-
42
 |
 |

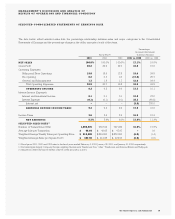
MANAGEMENT’S DISCUSSION AND ANALYSIS OF
RESULTS OF OPERATIONS AND FINANCIAL CONDITION (CONTINUED)
The Home Depot, Inc. and Subsidiaries
FORWARD-LOOKING STATEMENTS Certain written and oral
statements made by us or our authorized executive officers on our
behalf constitute “forward-looking statements”as defined under
the Private Securities Litigation Reform Act of 1995. Words or
phrases such as “should result,”“are expected to,”“we anticipate,”
“we estimate,”“we project”or similar expressions are intended to
identify forward-looking statements. These statements are subject
to certain risks and uncertainties that could cause actual results to
differ materially from our historical experience and our present
expectations or projections. These risks and uncertainties include,
but are not limited to, unanticipated weather conditions; stability of
costs and availability of sourcing channels; the ability to attract,
train and retain highly-qualified associates; conditions affecting the
availability, acquisition, development and ownership of real estate;
general economic conditions; the impact of competition; and reg-
ulatory and litigation matters.You should not place undue reliance
on forward-looking statements, since such statements speak only
as of the date of the making of such statements. Additional infor-
mation concerning these risks and uncertainties is contained in
our filings with the Securities and Exchange Commission, includ-
ing our Annual Report on Form 10-K.
RESULTS OF OPERATIONS For an understanding of the significant
factors that influenced our performance during the past three fis-
cal years, the following discussion should be read in conjunction
with the consolidated financial statements and the notes to consol-
idated financial statements presented in this annual report.
Fiscal year ended February 3, 2002 compared to January 28, 2001
Fiscal year 2001 consisted of 53 weeks compared to 52 weeks in
fiscal 2000. Net sales for fiscal 2001 increased 17.1% to $53.6 bil-
lion from $45.7 billion in fiscal 2000. This increase was attributable
to, among other things, the 204 new stores opened during fiscal
2001 and full year sales from the 204 new stores opened during
fiscal 2000. Approximately $880 million of the increase in sales
was attributable to the additional week in fiscal 2001. Comparable
store-for-store sales were flat in fiscal 2001 due to the weak eco-
nomic environment resulting from certain factors including, but
not limited to, low consumer confidence and high unemployment.
Gross profit as a percent of sales was 30.2% for fiscal 2001
compared to 29.9% for fiscal 2000. The rate increase was prima-
rily attributable to a lower cost of merchandise resulting from
product line reviews, purchasing synergies created by our newly
centralized merchandising structure and an increase in the num-
ber of tool rental centers from 342 at the end of fiscal 2000 to 466
at the end of fiscal 2001. We expect to have tool rental centers in
approximately 600 stores by the end of fiscal 2002.
Operating expenses as a percent of sales were 20.9% for fis-
cal 2001 compared to 20.7% for fiscal 2000. Selling and store
operating expenses as a percent of sales increased to 19.0% in
fiscal 2001 from 18.6% in fiscal 2000. The increase was primarily
attributable to growth in store occupancy costs resulting from
higher depreciation and property taxes due to our investment in
new stores, combined with increased energy costs. Also, credit
card transaction fees were higher than the prior year due to
increased penetration of total credit sales. These increases were
partially offset by a decrease in store payroll expense caused by
an improvement in labor productivity resulting from initiatives
inside the store and new systems enhancements.
Store initiatives include our Service Performance Improve-
ment (“SPI”) initiative which was implemented in every Home
Depot store in fiscal 2001. Under SPI our stores receive and
handle inventory at night, allowing our associates to spend more
time with customers during peak selling hours. In addition, our
Pro program was in 535 of our Home Depot stores at the end of
fiscal 2001, providing dedicated store resources to serve the
specific needs of professional customers. We expect to have our
Pro initiative in more than 950 stores at the end of fiscal 2002. SPI
and Pro have resulted in improved operational efficiency, safety
and customer service.
Pre-opening expenses as a percent of sales were 0.2% for
fiscal 2001 and 0.3% for fiscal 2000. We opened 204 new stores
in both fiscal 2001 and 2000. Pre-opening expenses averaged
$569,000 per store in fiscal 2001 compared to $671,000 per
store in fiscal 2000. The decrease in the average expense per
store was primarily due to shorter pre-opening periods as we
reengineered our store opening process.
20