Home Depot 2001 Annual Report Download - page 26
Download and view the complete annual report
Please find page 26 of the 2001 Home Depot annual report below. You can navigate through the pages in the report by either clicking on the pages listed below, or by using the keyword search tool below to find specific information within the annual report.-
 1
1 -
2
-
3
-
4
-
5
-
6
-
7
-
8
-
9
-
10
-
11
-
12
-
13
-
14
-
15
-
 16
16 -
 17
17 -
 18
18 -
 19
19 -
 20
20 -
 21
21 -
 22
22 -
 23
23 -
 24
24 -
 25
25 -
 26
26 -
 27
27 -
 28
28 -
 29
29 -
 30
30 -
 31
31 -
 32
32 -
 33
33 -
 34
34 -
 35
35 -
 36
36 -
37
-
38
-
39
-
40
-
41
-
42
 |
 |

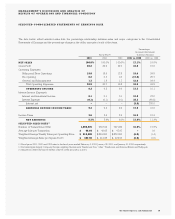
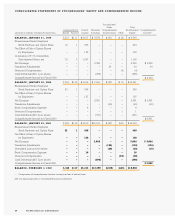
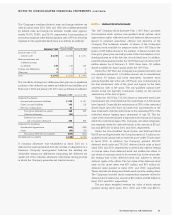
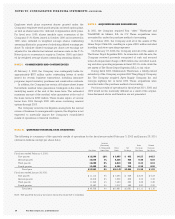
CONSOLIDATED STATEMENTS OF EARNINGS
The Home Depot, Inc. and Subsidiaries24
Fiscal Year Ended
amounts in millions, except per share data February 3, 2002 January 28, 2001 January 30, 2000
NET SALES $ 53,553 $ 45,738 $ 38,434
Cost of Merchandise Sold 37,406 32,057 27,023
Gross Profit 16,147 13,681 11,411
Operating Expenses:
Selling and Store Operating 10,163 8,513 6,819
Pre-Opening 117 142 113
General and Administrative 935 835 671
Total Operating Expenses 11,215 9,490 7,603
OPERATING INCOME 4,932 4,191 3,808
Interest Income (Expense):
Interest and Investment Income 53 47 37
Interest Expense (28) (21) (41)
Interest, net 25 26 (4)
EARNINGS BEFORE INCOME TAXES 4,957 4,217 3,804
Income Taxes 1,913 1,636 1,484
NET EARNINGS $ 3,044 $ 2,581 $ 2,320
BASIC EARNINGS PER SHARE $ 1.30 $ 1.11 $ 1.03
Weighted Average Number of Common Shares Outstanding 2,335 2,315 2,244
DILUTED EARNINGS PER SHARE $ 1.29 $ 1.10 $ 1.00
Weighted Average Number of Common Shares Outstanding Assuming Dilution 2,353 2,352 2,342
See accompanying notes to consolidated financial statements.