Home Depot 2001 Annual Report Download - page 23
Download and view the complete annual report
Please find page 23 of the 2001 Home Depot annual report below. You can navigate through the pages in the report by either clicking on the pages listed below, or by using the keyword search tool below to find specific information within the annual report.-
 1
1 -
2
-
3
-
4
-
5
-
6
-
7
-
8
-
9
-
10
-
11
-
12
-
 13
13 -
 14
14 -
 15
15 -
 16
16 -
 17
17 -
 18
18 -
 19
19 -
 20
20 -
 21
21 -
 22
22 -
 23
23 -
 24
24 -
 25
25 -
 26
26 -
 27
27 -
 28
28 -
 29
29 -
 30
30 -
 31
31 -
 32
32 -
 33
33 -
34
-
35
-
36
-
37
-
38
-
39
-
40
-
41
-
42
 |
 |

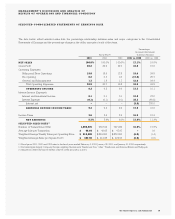
MANAGEMENT’S DISCUSSION AND ANALYSIS OF
RESULTS OF OPERATIONS AND FINANCIAL CONDITION (CONTINUED)
General and administrative expenses as a percent of sales
were 1.7% for fiscal 2001 compared to 1.8% in fiscal 2000. This
decrease was primarily due to cost savings associated with
the reorganization of certain components of our general and
administrative structure, such as the centralization of our mer-
chandising organization, and our focus on expense control in
areas such as travel.
Interest and investment income as a percent of sales was 0.1%
for both fiscal 2001 and 2000. Interest expense as a percent of
sales was 0.1% for both fiscal 2001 and 2000.
Our combined federal and state effective income tax rate
decreased to 38.6% for fiscal 2001 from 38.8% for fiscal 2000. The
decrease in fiscal 2001 was attributable to higher tax credits and
a lower effective state income tax rate compared to fiscal 2000.
Net earnings as a percent of sales were 5.7% for fiscal 2001
compared to 5.6% for fiscal 2000, reflecting the increased gross
profit rate, which was partially offset by higher store operating
expenses, as described above. Diluted earnings per share were
$1.29 for fiscal 2001 compared to $1.10 for fiscal 2000.
Fiscal year ended January 28, 2001 compared to January 30, 2000
Net sales for fiscal 2000 increased 19.0% to $45.7 billion from
$38.4 billion in fiscal 1999. This increase was attributable to,
among other things, full year sales from the 169 new stores
opened during fiscal 1999, a 4% comparable store-for-store sales
increase and 204 new store openings.
Gross profit as a percent of sales was 29.9% for fiscal 2000
compared to 29.7% for fiscal 1999. The rate increase was prima-
rily attributable to a lower cost of merchandise resulting from
product line reviews, benefits from global sourcing programs and
an increase in the number of tool rental centers from 150 at the
end of fiscal 1999 to 342 at the end of fiscal 2000.
Operating expenses as a percent of sales were 20.7% for
fiscal 2000 compared to 19.8% for fiscal 1999. Selling and store
operating expenses as a percent of sales increased to 18.6% in
fiscal 2000 from 17.8% in fiscal 1999. The increase was primarily
attributable to higher store selling payroll expenses resulting from
market wage pressures and an increase in employee longevity.
In addition, medical costs increased due to higher family enroll-
ment in our medical plans, rising health care costs and higher
prescription drug costs. Finally, store occupancy costs, including
property taxes, property rent, depreciation and utilities, increased
due to new store growth and energy rate increases.
Pre-opening expenses as a percent of sales were 0.3% for
both fiscal 2000 and 1999. We opened 204 new stores in fiscal
2000, compared to opening 169 new stores in fiscal 1999. Pre-
opening expenses averaged $671,000 per store in fiscal 2000
compared to $643,000 per store in fiscal 1999. The higher aver-
age expense was primarily due to the opening of more EXPO
Design Center stores and expansion of Home Depot stores into
certain new markets including international locations, which
involved longer pre-opening periods and higher training, travel
and relocation costs.
General and administrative expenses as a percent of sales
were 1.8% for fiscal 2000 compared to 1.7% for fiscal 1999. The
increase was primarily due to investments in Internet develop-
ment and international operations, as well as a full year of payroll
and other costs associated with operating four new divisional
offices, which opened during the fourth quarter of fiscal 1999.
Interest and investment income as a percent of sales was 0.1%
for both fiscal 2000 and 1999. Interest expense as a percent of
sales was 0.1% for both comparable periods.
Our combined federal and state effective income tax rate
decreased to 38.8% for fiscal 2000 from 39.0% for fiscal 1999. The
decrease was attributable to higher tax credits in fiscal 2000 com-
pared to fiscal 1999.
Net earnings as a percent of sales were 5.6% for fiscal 2000
compared to 6.0% for fiscal 1999, reflecting higher selling and store
operating expenses as a percent of sales partially offset by a high-
er gross profit rate as described above. Diluted earnings per share
were $1.10 for fiscal 2000 compared to $1.00 for fiscal 1999.
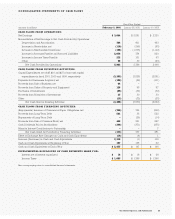
LIQUIDITY AND CAPITAL RESOURCES Cash flow generated from
operations provides us with a significant source of liquidity. For fis-
cal 2001, cash provided by operations increased to $6.0 billion from
$2.8 billion in fiscal 2000. The increase was primarily due to signif-
icant growth in days payable outstanding from 23 days at the end of
fiscal 2000 to 34 days at the end of fiscal 2001, a 12.7% decrease in
average inventory per store as of the end of fiscal 2001 and
increased operating income. The growth in days payable and
decrease in average inventory per store are the result of our efforts
to improve our working capital position by extending our payment
terms to industry standards and enhancing inventory assortments.
Cash used in investing activities, primarily comprised of cap-
ital expenditures, was $3.5 billion in both fiscal 2001 and 2000. We
opened 204 new stores in both fiscal 2001 and 2000. We own 188
of the stores opened in 2001 and lease the remainder.
We plan to open 200 stores in fiscal 2002 and expect total cap-
ital expenditures to be approximately $3.6 billion.
21The Home Depot, Inc. and Subsidiaries