Home Depot 2001 Annual Report Download - page 24
Download and view the complete annual report
Please find page 24 of the 2001 Home Depot annual report below. You can navigate through the pages in the report by either clicking on the pages listed below, or by using the keyword search tool below to find specific information within the annual report.-
 1
1 -
2
-
3
-
4
-
5
-
6
-
7
-
8
-
9
-
10
-
11
-
12
-
13
-
 14
14 -
 15
15 -
 16
16 -
 17
17 -
 18
18 -
 19
19 -
 20
20 -
 21
21 -
 22
22 -
 23
23 -
 24
24 -
 25
25 -
 26
26 -
 27
27 -
 28
28 -
 29
29 -
 30
30 -
 31
31 -
 32
32 -
 33
33 -
 34
34 -
35
-
36
-
37
-
38
-
39
-
40
-
41
-
42
 |
 |

MANAGEMENT’S DISCUSSION AND ANALYSIS OF
RESULTS OF OPERATIONS AND FINANCIAL CONDITION (CONTINUED)
The Home Depot, Inc. and Subsidiaries22
As of February 3, 2002, we had $2.5 billion in cash and cash
equivalents. We believe that our current cash position, internally
generated funds, funds available from the $1 billion commercial
paper program and the ability to obtain alternate sources of
financing should be sufficient to enable us to complete our capi-
tal expenditure programs through the next several fiscal years.
QUANTITATIVE AND QUALITATIVE DISCLOSURES ABOUT
MARKET RISK Our exposure to market risks results primarily
from fluctuations in interest rates. Although we have international
operating entities, our exposure to foreign currency rate fluctua-
tions is not significant to our financial condition and results. Our
objective for holding derivative instruments is to decrease the
volatility of earnings and cash flow associated with fluctuations in
these rates.
We have financial instruments that are sensitive to changes in
interest rates. These instruments include fixed rate debt and other
contractual arrangements. We issued $500 million of 53/8% Senior
Notes in fiscal 2001 maturing on April 1, 2006 and $500 million of
61/2% Senior Notes in fiscal 1999 maturing on September 15, 2004.
As of February 3, 2002, the market values of the publicly traded
53/8% and 61/2% Senior Notes were approximately $511 million and
$531 million, respectively. We have two interest rate swap agree-
ments, both designed to hedge the market risk associated with
interest rate volatility. We have one agreement in the notional
amount of $300 million that swaps fixed rate interest on $300
million of our $500 million 53/8% Senior Notes for a variable interest
rate equal to LIBOR plus 30 basis points and expires on April 1,
2006. We have another agreement expiring January 31, 2003 in
the notional amount of $690 million that swaps a variable interest
rate for a fixed rate of 63/4%, designed to mitigate the interest rate
risk related to the portfolio of our proprietary credit card, which is
serviced by a third party.
IMPACT OF INFLATION AND CHANGING PRICES Although we
cannot accurately determine the precise effect of inflation on
operations, we do not believe inflation has had a material effect on
sales or results of operations.
Cash used in financing activities in fiscal 2001 was $173 mil-
lion compared with cash provided by financing activities of $737
million in fiscal 2000. The increase in cash used was primarily due
to the net effect of repaying $754 million of commercial paper and
issuing $500 million of 53/8% Senior Notes during fiscal 2001.
We have a commercial paper program that allows borrowings
up to a maximum of $1 billion. As of February 3, 2002, there were
no borrowings outstanding under the program. In connection with
the program, we have a back-up credit facility with a consortium
of banks for up to $800 million. The credit facility, which expires in
September 2004, contains various restrictive covenants, none of
which are expected to impact our liquidity or capital resources.
We use capital, operating and other off-balance sheet leases to
finance about 20% of our real estate. Off-balance sheet leases
include three leases created under structured financing arrange-
ments to fund the construction of certain stores, office buildings and
distribution centers. Two of these lease agreements involve a special
purpose entity which meets the criteria established by generally
accepted accounting principles and is not owned by or affiliated with
the Company, its management or officers. Operating and off-balance
sheet leases are not reflected in our balance sheet in accordance
with generally accepted accounting principles.The net present value
of capital lease obligations is reflected in our balance sheet in long-
term debt. As of the end of fiscal 2001, our debt to equity ratio was
6.9%. If the estimated present value of future payments under the
operating and other off-balance sheet leases were capitalized, our
debt to equity ratio would increase to approximately 30%.
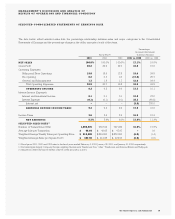
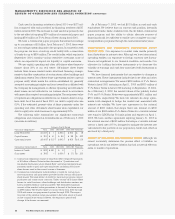
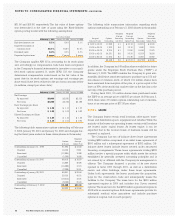
The following table summarizes our significant contractual
obligations and commercial commitments as of February 3, 2002
(amounts in millions):
Payments Due By Period
Contractual Obligations(1) Total 2002 2003-2004 2005-2006 Thereafter
Long-Term Debt $1,023 $ 1 $ 502 $ 502 $ 18
Capital Leases $ 791 $ 41 $ 85 $ 88 $ 577
Operating Leases $ 7,407 $ 517 $ 942 $ 809 $ 5,139
Amount of Commitment Expiration Per Period
Commercial Commitments(2) Total 2002 2003-2004 2005-2006 Thereafter
Letters of Credit $ 557 $ 551 $ 6 ––
Guarantees $ 799 –$ 504 $ 72 $ 223
(1) Contractual obligations consist of long-term debt comprised primarily
of $1 billion of Senior Notes further discussed in “Quantitative and
Qualitative Disclosures about Market Risk”and future minimum lease
payments under capital and operating leases, including off-balance
sheet leases, used in the normal course of business.
(2) Commercial commitments include letters of credit for certain busi-
ness transactions and guarantees provided under certain off-balance
sheet leases. We issue letters of credit for insurance programs, import
purchases and construction contracts. Under certain off-balance sheet
leases for retail locations, office buildings and distribution centers, we
have provided residual value guarantees. The estimated maximum
amount of the residual value guarantees at the end of the lease terms
is $799 million. The leases expire at various terms from 2004 through
2008 with some carrying renewal options through 2025. The expira-
tion date of the residual value guarantees in the table above is based
on the original lease terms; however, the expiration period will
change if the leases are renewed.