Home Depot 2000 Annual Report Download - page 34
Download and view the complete annual report
Please find page 34 of the 2000 Home Depot annual report below. You can navigate through the pages in the report by either clicking on the pages listed below, or by using the keyword search tool below to find specific information within the annual report.-
 1
1 -
2
-
3
-
4
-
5
-
6
-
7
-
8
-
9
-
10
-
11
-
12
-
13
-
14
-
15
-
16
-
17
-
18
-
19
-
20
-
21
-
22
-
23
-
 24
24 -
 25
25 -
 26
26 -
 27
27 -
 28
28 -
 29
29 -
 30
30 -
 31
31 -
 32
32 -
 33
33 -
 34
34 -
 35
35 -
 36
36 -
 37
37 -
 38
38 -
 39
39 -
 40
40
 |
 |
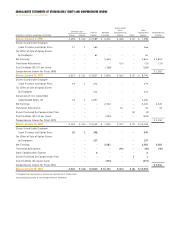
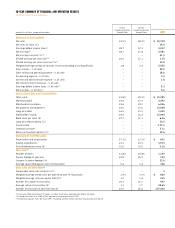
10-Year Summary of Financial and Operating Results
The Home Depot, Inc. and Subsidiaries
5 -Ye a r 1 0 -Ye a r
Compound Annual Compound Annual
amounts in millions, except where noted Growth Rate Growth Rate 2000
Statement of Earnings Data
Net sales 24.2% 28.2%
$ 45,738
Net sales increase (%) ––
19.0
Earnings before income taxes(2) 28.7 32.1
4,217
Net earnings(2) 28.7 31.8
2,581
Net earnings increase (%)(2) ––
11.3
Diluted earnings per share ($)(2,3) 26.5 27.1
1.10
Diluted earnings per share increase (%)(2) ––
10.0
Weighted average number of common shares outstanding assuming dilution 1.8 2.6
2,352
Gross margin – % of sales – –
29.9
Store selling and operating expense – % of sales – –
18.6
Pre-opening expense – % of sales – –
0.3
General and administrative expense – % of sales – –
1.8
Net interest income (expense) – % of sales – –
–
Earnings before income taxes – % of sales(2) ––
9.2
Net earnings – % of sales(2) ––
5.6
Balance Sheet Data and Financial Ratios
Total assets 23.8% 29.3%
$ 21,385
Working capital 22.0 27.4
3,392
Merchandise inventories 24.6 29.1
6,556
Net property and equipment 24.0 31.0
13,068
Long-term debt 16.5 11.3
1,545
Stockholders’ equity 24.6 36.2
15,004
Book value per share ($) 22.7 31.1
6.46
Long-term debt to equity (%) – –
10.3
Current ratio ––
1.77:1
Inventory turnover ––
5.1x
Return on invested capital (%)(2) ––
19.6
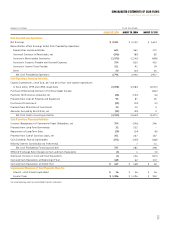
Statement of Cash Flows Data
Depreciation and amortization 27.1% 33.3%
$ 601
Capital expenditures 22.3 24.5
3,574
Cash dividends per share ($) 32.0 32.0
0.16
Store Data
(4)
Number of stores 21.8% 22.8%
1,134
Square footage at year-end 22.8 25.2
123
Increase in square footage (%) – –
22.6
Average square footage per store (in thousands) 0.6 1.6
108
Store Sales and Other Data
(4)
Comparable store sales increase (%)(5) ––
4
Weighted average weekly sales per operating store (in thousands) 1.9% 4.3%
$ 864
Weighted average sales per square foot ($)(5) 1.3 2.6
415
Number of customer transactions 20.4 23.7
937
Average sale per transaction ($) 3.1 3.7
48.65
Number of associates at year-end (actual) 23.0 26.6
227,300
(1)Fiscal year 1996 consisted of 53 weeks; all other fiscal years reported consisted of 52 weeks.
(2)Excludes the effect of a $104 million non-recurring charge in fiscal 1997.
(3)Diluted earnings per share for fiscal 1997, including a $104 million non-recurring charge, were $0.52.