Home Depot 2000 Annual Report Download - page 31
Download and view the complete annual report
Please find page 31 of the 2000 Home Depot annual report below. You can navigate through the pages in the report by either clicking on the pages listed below, or by using the keyword search tool below to find specific information within the annual report.-
 1
1 -
2
-
3
-
4
-
5
-
6
-
7
-
8
-
9
-
10
-
11
-
12
-
13
-
14
-
15
-
16
-
17
-
18
-
19
-
20
-
 21
21 -
 22
22 -
 23
23 -
 24
24 -
 25
25 -
 26
26 -
 27
27 -
 28
28 -
 29
29 -
 30
30 -
 31
31 -
 32
32 -
 33
33 -
 34
34 -
 35
35 -
 36
36 -
 37
37 -
 38
38 -
 39
39 -
 40
40
 |
 |

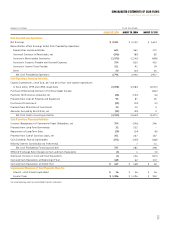
Notes to Consolidated Financial Statements (continued)
The Home Depot, Inc. and Subsidiaries
28
29
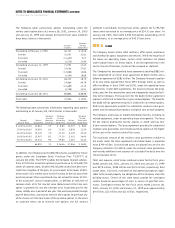
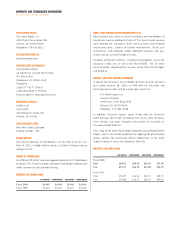
The approximate future minimum lease payments under capital and
operating leases at January 28, 2001 were as follows (in millions):
Capital Operating
Fiscal Year Leases Leases
2001 $ 38 $ 512
2002 38 512
2003 38 478
2004 38 440
2005 39 411
Thereafter 519 5,132
710 $ 7,485
Less imputed interest 480
Net present value of capital lease obligations 230
Less current installments 3
Long-term capital lease obligations,
excluding current installments $ 227
Short-term and long-term obligations for capital leases are included
in the Company’s Consolidated Balance Sheets in Current Installments
of Long-Term Debt and Long-Term Debt, respectively. The assets under
capital leases recorded in Net Property and Equipment, net of amor-
tization, totaled $213 million and $208 million at January 28, 2001
and January 30, 2000, respectively.
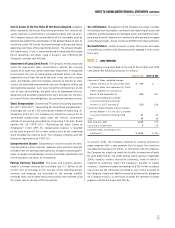
Note 6. Employee Benefit Plans
The Company maintains a defined contribution plan (“401(k)”) that
covers substantially all associates meeting certain service requirements.
The Company makes weekly matching cash contributions to purchase
shares of the Company’s common stock, up to specified percentages of
associates’ contributions as approved by the Board of Directors.
The Company also maintains a 401(k) Restoration Plan to provide
certain associates deferred compensation that they would have received
under the 401(k) matching contribution if not for the maximum
compensation limits under the Internal Revenue Code. The Company
funds the 401(k) Restoration Plan through contributions made to a
“rabbi trust,” which are then used to purchase shares of the Company’s
common stock in the open market. Compensation expense related to
this plan for fiscal years 2000, 1999 and 1998 was not material.
During February 1999, the Company made its final contribution
to the Employee Stock Ownership Plan and Trust (“ESOP”), which
was originally established during fiscal 1988. The ESOP covered
substantially all full-time associates and purchased shares of the
Company’s common stock in the open market through a combination
of contributions and loans made by the Company. All loans made
from the Company have been repaid.
The Company’s combined contributions to the 401(k) and ESOP were
$84 million, $57 million and $41 million for fiscal years 2000, 1999
and 1998, respectively. At January 28, 2001, the 401(k) and the
ESOP held a total of 33,144,570 shares of the Company’s common
stock in trust for plan participants.
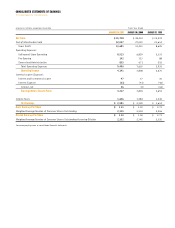
Note 7. Basic and Diluted Earnings Per Share
The calculations of basic and diluted earnings per share for fiscal
years 2000, 1999 and 1998 were as follows (amounts in millions,
except per share data):
Fiscal Year Ended
January 28, 2001 January 30, 2000 January 31, 1999
Calculation of Basic
Earnings Per Share:
Net earnings
$ 2,581
$ 2,320 $ 1,614
Weighted average number of
common shares outstanding
2,315
2,244 2,206
Basic Earnings Per Share
$1.11
$ 1.03 $ 0.73
Calculation of Diluted
Earnings Per Share:
Net earnings
$ 2,581
$ 2,320 $ 1,614
Tax-effected interest expense
attributable to 31⁄4% Notes – 17 23
Net earnings assuming dilution
$ 2,581
$ 2,337 $ 1,637
Weighted average number of
common shares outstanding
2,315
2,244 2,206
Effect of potentially
dilutive securities:
31⁄4% Notes
–
51 72
Employee stock plans
37
47 42
Weighted average number of
common shares outstanding
assuming dilution
2,352
2,342 2,320
Diluted Earnings Per Share
$1.10
$ 1.00 $ 0.71
Employee stock plans represent shares granted under the Company’s
employee stock purchase plan and stock option plans, as well as
shares issued for deferred compensation stock plans. For fiscal years
1999 and 1998, shares issuable upon conversion of the Company’s
31⁄4% Notes, issued in October 1996, were included in weighted
average shares assuming dilution for purposes of calculating diluted
earnings per share. To calculate diluted earnings per share, net earn-
ings are adjusted for tax-effected net interest and issue costs on the
31⁄4% Notes (prior to conversion to equity in October 1999) and divided
by weighted average shares assuming dilution.