Home Depot 2000 Annual Report Download - page 18
Download and view the complete annual report
Please find page 18 of the 2000 Home Depot annual report below. You can navigate through the pages in the report by either clicking on the pages listed below, or by using the keyword search tool below to find specific information within the annual report.-
 1
1 -
2
-
3
-
4
-
5
-
6
-
7
-
 8
8 -
 9
9 -
 10
10 -
 11
11 -
 12
12 -
 13
13 -
 14
14 -
 15
15 -
 16
16 -
 17
17 -
 18
18 -
 19
19 -
 20
20 -
 21
21 -
 22
22 -
 23
23 -
 24
24 -
 25
25 -
 26
26 -
 27
27 -
 28
28 -
29
-
30
-
31
-
32
-
33
-
34
-
35
-
36
-
37
-
38
-
39
-
40
 |
 |

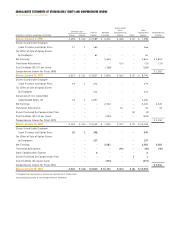
Management’s Discussion and Analysis of Results of Operations and Financial Condition
The Home Depot, Inc. and Subsidiaries
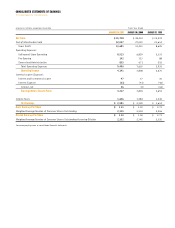
The data below reflect selected sales data, the percentage relationship between sales and major categories in the Consolidated Statements of
Earnings and the percentage change in the dollar amounts of each of the items.
Selected Consolidated Statements of Earnings Data
Percentage
Increase (Decrease)
Fiscal Year(1) In Dollar Amounts
2000 1999 1998 2000 vs. 1999 1999 vs. 1998
Net Sales
100.0%
100.0% 100.0%
19.0%
27.2%
Gross Profit
29.9
29.7 28.5
19.9
32.6
Operating Expenses:
Selling and Store Operating
18.6
17.8 17.7
24.8
27.9
Pre-Opening
0.3
0.3 0.3
25.7
28.4
General and Administrative
1.8
1.7 1.7
24.4
30.3
Total Operating Expenses
20.7
19.8 19.7
24.8
28.1
Operating Income
9.2
9.9 8.8
10.1
42.6
Interest Income (Expense):
Interest and Investment Income
0.1
0.1 0.1
27.0
23.3
Interest Expense
(0.1)
(0.1) (0.1)
(48.8)
(10.9)
Interest, net
–
––
750.0
(75.0)
Earnings Before Income Taxes
9.2
9.9 8.8
10.9
43.3
Income Taxes
3.6
3.9 3.5
10.2
42.7
Net Earnings
5.6%
6.0% 5.3%
11.3%
43.7%
Selected Sales Data
(2)
Number of Transactions (000s)
936,519
797,229 665,125
17.5%
19.9%
Average Sale per Transaction
$ 48.65
$ 47.87 $ 45.05
1.6
6.3
Weighted Average Weekly Sales per Operating Store
$ 864,000
$ 876,000 $ 844,000
(1.4)
3.8
Weighted Average Sales per Square Foot
$ 414.68
$ 422.53 $ 409.79
(1.9)
3.1
(1) Fiscal years 2000, 1999 and 1998 refer to the fiscal years ended January 28, 2001; January 30, 2000; and January 31, 1999, respectively.
(2) Excludes wholly-owned subsidiaries: Apex Supply Company, Georgia Lighting, Maintenance Warehouse, and National Blinds and Wallpaper.