Home Depot 2000 Annual Report Download - page 19
Download and view the complete annual report
Please find page 19 of the 2000 Home Depot annual report below. You can navigate through the pages in the report by either clicking on the pages listed below, or by using the keyword search tool below to find specific information within the annual report.-
 1
1 -
2
-
3
-
4
-
5
-
6
-
7
-
8
-
 9
9 -
 10
10 -
 11
11 -
 12
12 -
 13
13 -
 14
14 -
 15
15 -
 16
16 -
 17
17 -
 18
18 -
 19
19 -
 20
20 -
 21
21 -
 22
22 -
 23
23 -
 24
24 -
 25
25 -
 26
26 -
 27
27 -
 28
28 -
 29
29 -
30
-
31
-
32
-
33
-
34
-
35
-
36
-
37
-
38
-
39
-
40
 |
 |

Management’s Discussion and Analysis of Results of Operations and Financial Condition (continued)
The Home Depot, Inc. and Subsidiaries
16
17
Forward-Looking Statements Certain written and oral statements made
by The Home Depot, Inc. and subsidiaries (the “Company”) or with
the approval of an authorized executive officer of the Company may
constitute “forward-looking statements” as defined under the Private
Securities Litigation Reform Act of 1995. Words or phrases such as
“should result,” “are expected to,” “we anticipate,” “we estimate,”
“we project” or similar expressions are intended to identify forward-
looking statements. These statements are subject to certain risks and
uncertainties that could cause actual results to differ materially from
the Company’s historical experience and its present expectations or
projections. These risks and uncertainties include, but are not limited
to, unanticipated weather conditions; stability of costs and availability
of sourcing channels; the ability to attract, train and retain highly-
qualified associates; conditions affecting the availability, acquisition,
development and ownership of real estate; general economic condi-
tions; the impact of competition; and regulatory and litigation
matters. Caution should be taken not to place undue reliance on any
such forward-looking statements, since such statements speak only as
of the date of the making of such statements. Additional information
concerning these risks and uncertainties is contained in the Company’s
filings with the Securities and Exchange Commission, including the
Company’s Annual Report on Form 10-K.
Results Of Operations For an understanding of the significant factors
that influenced the Company’s performance during the past three fiscal
years, the following discussion should be read in conjunction with the
consolidated financial statements and the notes to consolidated finan-
cial statements presented in this annual report.
Fiscal Year ended January 28, 2001 compared to January 30,
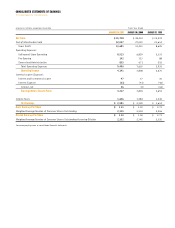
2000 Net sales for fiscal 2000 increased 19.0% to $45.7 billion
from $38.4 billion in fiscal 1999. This increase was attributable to,
among other things, full year sales from the 169 new stores opened
during fiscal 1999, a 4% comparable store-for-store sales increase and
204 new store openings.
Gross profit as a percent of sales was 29.9% for fiscal 2000 compared
to 29.7% for fiscal 1999. The rate increase was primarily attributable
to a lower cost of merchandise resulting from product line reviews,
benefits from global sourcing programs and an increase in the number
of tool rental centers from 150 at the end of fiscal 1999 to 342 at the
end of fiscal 2000.
Operating expenses as a percent of sales were 20.7% for fiscal 2000
compared to 19.8% for fiscal 1999. Selling and store operating
expenses as a percent of sales increased to 18.6% in fiscal 2000 from
17.8% in fiscal 1999. The increase was primarily attributable to
higher store selling payroll expenses resulting from market wage pres-
sures and an increase in employee longevity. In addition, medical
costs increased due to higher family enrollment in the Company’s
medical plans, rising health care costs and higher prescription drug
costs. Finally, store occupancy costs, such as property taxes, property
rent, depreciation and utilities, increased due to new store growth and
energy rate increases.
Pre-opening expenses as a percent of sales were 0.3% for both fiscal
2000 and 1999. The Company opened 204 new stores and relocated
8 stores in fiscal 2000, compared to opening 169 new stores and
relocating 6 stores in fiscal 1999. Pre-opening expenses averaged
$671,000 per store in fiscal 2000 compared to $643,000 per store in
fiscal 1999. The higher average expense was primarily due to the open-
ing of more EXPO Design Center stores and expansion of Home Depot
stores into certain new markets including international locations, which
involved longer pre-opening periods and higher training, travel and
relocation costs.
General and administrative expenses as a percent of sales were 1.8%
for fiscal 2000 compared to 1.7% for fiscal 1999. The increase was
primarily due to investments in Internet development and inter-
national operations, as well as a full year of payroll and other costs
associated with operating four new divisional offices, which opened
during the fourth quarter of fiscal 1999.
Interest and investment income as a percent of sales was 0.1% for
both fiscal 2000 and 1999. Interest expense as a percent of sales was
0.1% for both comparable periods.
The Company’s combined federal and state effective income tax
rate decreased to 38.8% for fiscal 2000 from 39.0% for fiscal 1999.
The decrease was attributable to higher tax credits in fiscal 2000
compared to fiscal 1999.
Net earnings as a percent of sales were 5.6% for fiscal 2000
compared to 6.0% for fiscal 1999, reflecting higher selling and store
operating expenses as a percent of sales partially offset by a higher
gross profit rate as described above. Diluted earnings per share were
$1.10 for fiscal 2000 compared to $1.00 for fiscal 1999.