Home Depot 2000 Annual Report Download - page 20
Download and view the complete annual report
Please find page 20 of the 2000 Home Depot annual report below. You can navigate through the pages in the report by either clicking on the pages listed below, or by using the keyword search tool below to find specific information within the annual report.-
 1
1 -
2
-
3
-
4
-
5
-
6
-
7
-
8
-
9
-
 10
10 -
 11
11 -
 12
12 -
 13
13 -
 14
14 -
 15
15 -
 16
16 -
 17
17 -
 18
18 -
 19
19 -
 20
20 -
 21
21 -
 22
22 -
 23
23 -
 24
24 -
 25
25 -
 26
26 -
 27
27 -
 28
28 -
 29
29 -
 30
30 -
31
-
32
-
33
-
34
-
35
-
36
-
37
-
38
-
39
-
40
 |
 |

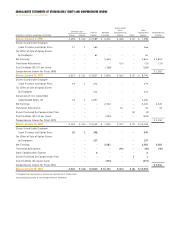
Management’s Discussion and Analysis of Results of Operations and Financial Condition (continued)
The Home Depot, Inc. and Subsidiaries
Fiscal Year ended January 30, 2000 compared to January 31,
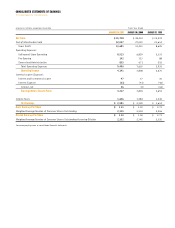
1999 Net sales for fiscal 1999 increased 27.2% to $38.4 billion from
$30.2 billion in fiscal 1998. This increase was attributable to, among
other things, full year sales from the 138 new stores opened during
fiscal 1998, a 10% comparable store-for-store sales increase, and 169
new store openings and 6 store relocations during fiscal 1999.
Gross profit as a percent of sales was 29.7% for fiscal 1999 compared
to 28.5% for fiscal 1998. The rate increase was primarily attributable
to a lower cost of merchandise resulting from product line reviews
and increased sales of imported products, and other merchandising
initiatives begun in prior years and continued during fiscal 1999, as
well as to sales mix shifts to higher gross margin product categories
and assortments. In addition, inventory and refund systems improve-
ments and more effective training resulted in better inventory shrink
results and lower product markdowns.
Operating expenses as a percent of sales were 19.8% for fiscal 1999
compared to 19.7% for fiscal 1998. Selling and store operating
expenses as a percent of sales increased to 17.8% in fiscal 1999 from
17.7% in fiscal 1998. The increase was primarily attributable to higher
store selling payroll expenses resulting from market wage pressures
and an increase in employee longevity, as well as by the Company’s
continued investment in new customer service initiatives. In addition,
medical costs increased due to higher family enrollment in the
Company’s medical plans, increased claims and higher prescription
drug costs. The Company’s strong financial performance during fiscal
1999 also resulted in higher bonus expenses as a percent of sales.
Credit card discounts increased as a result of higher penetrations
of credit card sales and increases in non-private label discount rates.
Partially offsetting these increases were lower net advertising
expenses resulting from higher cooperative advertising participation
by vendors and economies realized from the increased use of national
advertising.
Pre-opening expenses as a percent of sales were 0.3% for both fiscal
1999 and 1998. The Company opened 169 new stores and relocated
6 stores in fiscal 1999, compared to 138 new stores and 4 store relo-
cations in fiscal 1998. Pre-opening expenses averaged $643,000 per
store in fiscal 1999 compared to $618,000 per store in fiscal 1998.
The higher average expense was primarily due to the opening of more
EXPO Design Center stores and expansion of Home Depot stores into
certain new markets, which involved longer pre-opening periods and
higher training, travel and relocation costs.
General and administrative expenses as a percent of sales were 1.7%
for both fiscal 1999 and 1998. Incremental expenses related to long-
term growth and business planning initiatives, including Internet
development, international operations and the opening of four new
divisional offices during the fourth quarter of fiscal 1999, were offset
by efficiencies realized from increased sales.
Interest and investment income as a percent of sales was 0.1% for
both fiscal 1999 and 1998. Interest expense as a percent of sales was
0.1% for both comparable periods.
The Company’s combined federal and state effective income tax rate
decreased to 39.0% for fiscal 1999 from 39.2% for fiscal 1998. The
decrease was attributable to higher tax credits in fiscal 1999 compared
to fiscal 1998.
Net earnings as a percent of sales were 6.0% for fiscal 1999
compared to 5.3% for fiscal 1998, reflecting a higher gross profit
rate partially offset by higher operating expenses as a percent of sales
as described above. Diluted earnings per share were $1.00 for fiscal
1999 compared to $0.71 for fiscal 1998.
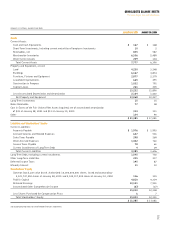
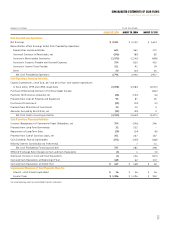
Liquidity and Capital Resources Cash flow generated from store oper-
ations provides the Company with a significant source of liquidity.
Additionally, a portion of the Company’s inventory is financed under
vendor credit terms.
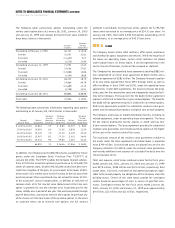
The Company currently plans to open approximately 200 new stores
and relocate 9 existing stores during fiscal 2001. It is anticipated
that approximately 92% of these locations will be owned, and the
remainder will be leased.
The Company has two operating lease agreements totaling $882 mil-
lion for the purpose of financing construction costs of certain new
stores. Under the operating lease agreements, the lessor purchases the
properties, pays for the construction costs and subsequently leases the
facilities to the Company. The leases provide for substantial residual
value guarantees and include purchase options at original cost on
each property. The Company financed a portion of its new stores
opened from fiscal 1997 through fiscal 2000, as well as office build-
ings in fiscal 1999 and 2000, under the operating lease agreements.