GE 2009 Annual Report Download - page 99
Download and view the complete annual report
Please find page 99 of the 2009 GE annual report below. You can navigate through the pages in the report by either clicking on the pages listed below, or by using the keyword search tool below to find specific information within the annual report.-
 1
1 -
2
-
3
-
4
-
5
-
6
-
7
-
8
-
9
-
10
-
11
-
12
-
13
-
14
-
15
-
16
-
17
-
18
-
19
-
20
-
21
-
22
-
23
-
24
-
25
-
26
-
27
-
28
-
29
-
30
-
31
-
32
-
33
-
34
-
35
-
36
-
37
-
38
-
39
-
40
-
41
-
42
-
43
-
44
-
45
-
46
-
47
-
48
-
49
-
50
-
51
-
52
-
53
-
54
-
55
-
56
-
57
-
58
-
59
-
60
-
61
-
62
-
63
-
64
-
65
-
66
-
67
-
68
-
69
-
70
-
71
-
72
-
73
-
74
-
75
-
76
-
77
-
78
-
79
-
80
-
81
-
82
-
83
-
84
-
85
-
86
-
87
-
88
-
 89
89 -
 90
90 -
 91
91 -
 92
92 -
 93
93 -
 94
94 -
 95
95 -
 96
96 -
 97
97 -
 98
98 -
 99
99 -
 100
100 -
 101
101 -
 102
102 -
 103
103 -
 104
104 -
 105
105 -
 106
106 -
 107
107 -
 108
108 -
 109
109 -
110
-
111
-
112
-
113
-
114
-
115
-
116
-
117
-
118
-
119
-
120
-
121
-
122
-
123
-
124
 |
 |

GE 2009 ANNUAL REPORT 97
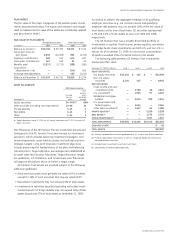
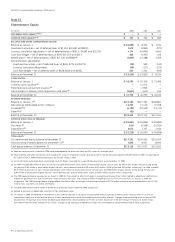
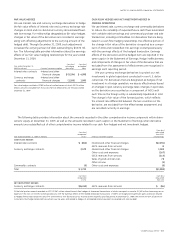
Note 17.
Other Income
(In millions) 2009 2008 2007
GE
Associated companies (a) $ 667 $ 332 $ 671
Purchases and sales of business
interests (b) 363 891 1,541
Licensing and royalty income 217 291 255
Interest income from GECS 173 371 329
Marketable securities and bank deposits 54 196 282
Other items (295) (116) 293
1,179 1,965 3,371
ELIMINATIONS (173) (379) (352)
Total $1,006 $1,586 $ 3,019
(a) Included a gain of $552 million related to dilution of our interest in A&E Television
Network from 25% to 15.8% in 2009.
(b) In 2009, included a gain of $254 million related to our increased ownership in
ATI-Singapore from 49% to 100%. See Note 8. In 2007, included gain on sale of a
business interest to Hitachi of $900 million.
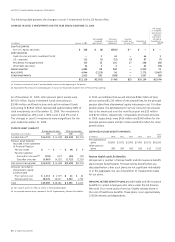
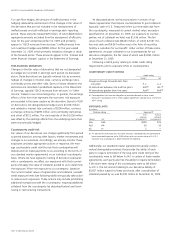
Note 18.
GECS Revenues from Services
(In millions) 2009 2008 2007
Interest on loans $20,080 $27,109 $23,599
Equipment leased to others 12,231 15,568 15,260
Fees 4,634 6,126 6,533
Investment income (a) 3,391 2,191 4,724
Financing leases 3,322 4,374 4,699
Premiums earned by insurance
activities 2,065 2,255 2,232
Net securitization gains 1,589 1,133 1,804
Real estate investments 1,543 3,505 4,669
Associated companies 1,059 2,217 2,172
Other items (b) (c) 3,279 5,036 5,526
Total $53,193 $69,514 $71,218
(a) Included gain on sale of Swiss Re common stock of $566 million in 2007 and net
other-than-temporary impairments on investment securities of $583 million,
$1,420 million and $127 million in 2009, 2008 and 2007, respectively. Of the
$583 million, $33 million related to impairments recognized in the first quarter of
2009 that were reclassified to retained earnings as a result of the amendments to
ASC 320. See Note 3.
(b) Included a gain on the sale of a partial interest in a limited partnership in PTL and
a related gain on the remeasurement of the retained investment to fair value
totaling $296 million in the first quarter of 2009. See Note 23.
(c) Included a gain of $343 million on the remeasurement to fair value of our equity
method investment in BAC, following our acquisition of a controlling interest in the
second quarter of 2009. See Note 8.
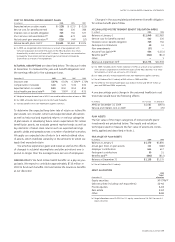
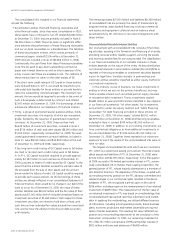
Note 19.
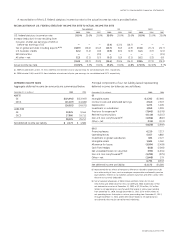
Supplemental Cost Information
We funded research and development expenditures of $3,324 mil-
lion in 2009, $3,113 million in 2008 and $3,048 million in 2007.
Research and development costs are classified in cost of goods
sold in the Statement of Earnings. In addition, research and
development funding from customers, principally the U.S. gov-
ernment, totaled $1,050 million, $1,287 million and $1,067 million
in 2009, 2008 and 2007, respectively.
Rental expense under operating leases is shown below.
(In millions) 2009 2008 2007
GE $1,012 $912 $929
GECS 817 992 955
At December 31, 2009, minimum rental commitments under
noncancellable operating leases aggregated $2,674 million and
$2,888 million for GE and GECS, respectively. Amounts payable
over the next five years follow.
(In millions) 2010 2011 2012 2013 2014
GE $592 $495 $416 $334 $278
GECS 609 498 436 288 211
GE’s selling, general and administrative expenses totaled
$14,842 million in 2009, $14,401 million in 2008 and $14,148 mil-
lion in 2007.
Our Technology Infrastructure and Energy Infrastructure
segments enter into collaborative arrangements with manufac-
turers and suppliers of components used to build and maintain
certain engines, aero-derivatives, and turbines, under which GE
and these participants share in risks and rewards of these product
programs. Under these arrangements, participation fees earned
and recorded as other income totaled $1 million, $394 million
and $481 million for the years 2009, 2008 and 2007, respectively.
Payments to participants are recorded as costs of services sold
($504 million, $423 million and $320 million for the years 2009,
2008 and 2007, respectively) or as cost of goods sold ($1,731 mil-
lion, $1,882 million and $1,573 million for the years 2009, 2008
and 2007, respectively).