GE 2009 Annual Report Download - page 47
Download and view the complete annual report
Please find page 47 of the 2009 GE annual report below. You can navigate through the pages in the report by either clicking on the pages listed below, or by using the keyword search tool below to find specific information within the annual report.-
 1
1 -
2
-
3
-
4
-
5
-
6
-
7
-
8
-
9
-
10
-
11
-
12
-
13
-
14
-
15
-
16
-
17
-
18
-
19
-
20
-
21
-
22
-
23
-
24
-
25
-
26
-
27
-
28
-
29
-
30
-
31
-
32
-
33
-
34
-
35
-
36
-
 37
37 -
 38
38 -
 39
39 -
 40
40 -
 41
41 -
 42
42 -
 43
43 -
 44
44 -
 45
45 -
 46
46 -
 47
47 -
 48
48 -
 49
49 -
 50
50 -
 51
51 -
 52
52 -
 53
53 -
 54
54 -
 55
55 -
 56
56 -
 57
57 -
58
-
59
-
60
-
61
-
62
-
63
-
64
-
65
-
66
-
67
-
68
-
69
-
70
-
71
-
72
-
73
-
74
-
75
-
76
-
77
-
78
-
79
-
80
-
81
-
82
-
83
-
84
-
85
-
86
-
87
-
88
-
89
-
90
-
91
-
92
-
93
-
94
-
95
-
96
-
97
-
98
-
99
-
100
-
101
-
102
-
103
-
104
-
105
-
106
-
107
-
108
-
109
-
110
-
111
-
112
-
113
-
114
-
115
-
116
-
117
-
118
-
119
-
120
-
121
-
122
-
123
-
124
 |
 |

’
GE 2009 ANNUAL REPORT 45
CLL — ASIA. Nonearning receivables of $0.6 billion represented
4.3% of total nonearning receivables at December 31, 2009.
The ratio of allowance for losses as a percent of nonearning
receivables declined from 53.3% at December 31, 2008, to 42.4%
at December 31, 2009, primarily due to an increase in nonearn-
ing receivables in secured exposures, which did not require
significant specific reserves based upon the strength of the
underlying collateral values. The ratio of nonearning receivables
as a percent of financing receivables increased from 1.8% at
December 31, 2008, to 4.4% at December 31, 2009, primarily
from an increase in nonearning receivables at our corporate
asset-based, distribution finance and corporate air secured
financing businesses in Japan, Australia, New Zealand and India
and a lower financing receivables balance.
CONSUMER — NON-U.S. RESIDENTIAL MORTGAGES. Nonearning
receivables of $4.6 billion represented 34.3% of total nonearning
receivables at December 31, 2009. The ratio of allowance for
losses as a percent of nonearning receivables increased from
11.5% at December 31, 2008, to 20.9% at December 31, 2009.
In 2009, our nonearning receivables increased primarily as a result
of the continued decline in the U.K. housing market, partially
offset by increased foreclosures. Our non-U.S. mortgage portfolio
has a loan-to-value ratio of approximately 75% at origination
and the vast majority are first lien positions. Our U.K. and France
portfolios, which comprise a majority of our total mortgage
portfolio, have reindexed loan-to-value ratios of 82% and 68%,
respectively. Less than 4% of these loans are without mortgage
insurance and have a reindexed loan-to-value ratio equal to or
greater than 100%. Loan-to-value information is updated on a
quarterly basis for a majority of our loans and considers economic
factors such as the housing price index. At December 31, 2009,
we had in repossession stock approximately 1,200 houses in the
U.K., which had a value of approximately $0.2 billion.
CONSUMER — NON-U.S. INSTALLMENT AND REVOLVING CREDIT.
Nonearning receivables of $0.5 billion represented 3.4% of total
nonearning receivables at December 31, 2009. The ratio of allow-
ance for losses as a percent of nonearning receivables increased
from 254.5% at December 31, 2008, to 261.5% at December 31,
2009, reflecting increases in allowance for loan losses, partially
offset by the effects of loan repayments and reduced originations.
Allowance for losses as a percent of financing receivables increased
from 4.3% at December 31, 2008, to 4.7% at December 31, 2009,
as increases in allowance for loan losses were driven by the effects
of increased delinquencies in Europe and Australia, partially offset
by the effects of business dispositions.
CONSUMER — U.S. INSTALLMENT AND REVOLVING CREDIT.
Nonearning receivables of $0.8 billion represented 6.3% of total
nonearning receivables at December 31, 2009. The ratio of allow-
ance for losses as a percent of nonearning receivables declined
from 224.3% at December 31, 2008, to 201.9% at December 31,
2009, as a result of the effects of loan repayments and better
entry rates, partially offset by increases in the allowance for loan
losses due to the effects of the continued deterioration in our
U.S. portfolio in connection with rising unemployment.
REAL ESTATE. Nonearning receivables of $1.3 billion represented
9.4% of total nonearning receivables at December 31, 2009. The
$1.1 billion increase in nonearning receivables from December 31,
2008, was driven primarily by increased delinquencies in the U.S.
apartment and office loan portfolios, which have been adversely
affected by rent and occupancy declines. The ratio of allowance
for losses as a percent of total financing receivables increased
from 0.6% at December 31, 2008, to 3.3% at December 31, 2009,
driven primarily by continued economic deterioration in the
U.S. and the U.K. markets, which resulted in an increase in both
specific and general credit loss provisions. The ratio of allowance
for losses as a percent of nonearning receivables declined from
155.2% at December 31, 2008, to 119.3% at December 31, 2009,
reflecting a higher proportion of the allowance being attributable
to specific reserves and our estimate of underlying collateral
values. The allowance for losses on our real estate receivables
may continue to be adversely affected as the overall challenging
economic environment continues to pressure underlying property
values. At December 31, 2009, real estate held for investment
included $0.8 billion representing 82 foreclosed commercial real
estate properties.
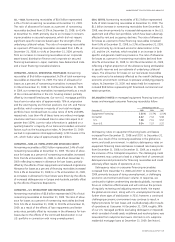
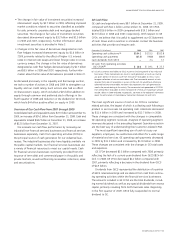
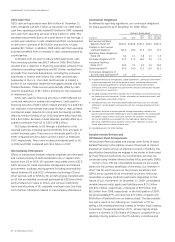
DELINQUENCY RATES on managed equipment financing loans and
leases and managed consumer financing receivables follow.
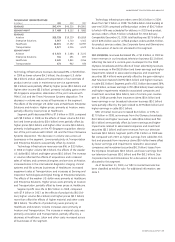
Delinquency rates at
December 31 2009 2008 2007
Equipment Financing 2.81% 2.17% 1.21%
Consumer 8.82 7.43 5.38
U.S. 7.66 7.14 5.52
Non-U.S. 9.34 7.57 5.32
Delinquency rates on equipment financing loans and leases
increased from December 31, 2008 and 2007, to December 31,
2009, as a result of the continuing weakness in the global eco-
nomic and credit environment. In addition, delinquency rates on
equipment financing loans and leases increased nine basis points
from December 31, 2008, to December 31, 2009, as a result of
the inclusion of the CitiCapital acquisition. The challenging credit
environment may continue to lead to a higher level of commercial
delinquencies and provisions for financing receivables and could
adversely affect results of operations at CLL.
Delinquency rates on consumer financing receivables
increased from December 31, 2008 and 2007, to December 31,
2009, primarily because of rising unemployment, a challenging
economic environment and lower volume. In response, we
continued to tighten underwriting standards globally, increased
focus on collection effectiveness and will continue the process
of regularly reviewing and adjusting reserve levels. We expect
the global environment, along with U.S. unemployment levels, to
further show signs of stabilization in 2010; however, a continued
challenging economic environment may continue to result in
higher provisions for loan losses and could adversely affect results
of operations at Consumer. At December 31, 2009, roughly 39%
of our U.S. managed portfolio (excluding delinquent or impaired),
which consisted of credit cards, installment and revolving loans, was
receivable from subprime borrowers. We had no U.S. subprime
residential mortgage loans at December 31, 2009. See Note 6.