GE 2009 Annual Report Download - page 106
Download and view the complete annual report
Please find page 106 of the 2009 GE annual report below. You can navigate through the pages in the report by either clicking on the pages listed below, or by using the keyword search tool below to find specific information within the annual report.-
 1
1 -
2
-
3
-
4
-
5
-
6
-
7
-
8
-
9
-
10
-
11
-
12
-
13
-
14
-
15
-
16
-
17
-
18
-
19
-
20
-
21
-
22
-
23
-
24
-
25
-
26
-
27
-
28
-
29
-
30
-
31
-
32
-
33
-
34
-
35
-
36
-
37
-
38
-
39
-
40
-
41
-
42
-
43
-
44
-
45
-
46
-
47
-
48
-
49
-
50
-
51
-
52
-
53
-
54
-
55
-
56
-
57
-
58
-
59
-
60
-
61
-
62
-
63
-
64
-
65
-
66
-
67
-
68
-
69
-
70
-
71
-
72
-
73
-
74
-
75
-
76
-
77
-
78
-
79
-
80
-
81
-
82
-
83
-
84
-
85
-
86
-
87
-
88
-
89
-
90
-
91
-
92
-
93
-
94
-
95
-
 96
96 -
 97
97 -
 98
98 -
 99
99 -
 100
100 -
 101
101 -
 102
102 -
 103
103 -
 104
104 -
 105
105 -
 106
106 -
 107
107 -
 108
108 -
 109
109 -
 110
110 -
 111
111 -
 112
112 -
 113
113 -
 114
114 -
 115
115 -
 116
116 -
117
-
118
-
119
-
120
-
121
-
122
-
123
-
124
 |
 |
104 GE 2009 ANNUAL REPORT
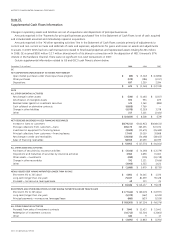
For cash flow hedges, the amount of ineffectiveness in the
hedging relationship and amount of the changes in fair value of
the derivative that are not included in the measurement of
ineffectiveness are both reflected in earnings each reporting
period. These amounts totaled $49 million, of which $(18) million
represents amounts excluded from the assessment of effective-
ness for the year ended December 31, 2009, and primarily
appear in “GECS revenues from services.” Ineffectiveness from
net investment hedges was $(899) million for the year ended
December 31, 2009, which primarily related to changes in value
of the forward points. These amounts appear in the “Interest and
other financial charges” caption in the Statement of Earnings.
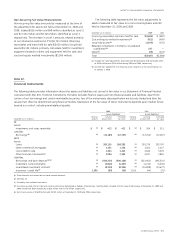
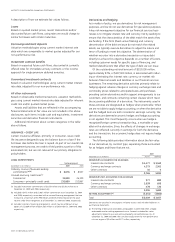
FREE-STANDING DERIVATIVES
Changes in the fair value of derivatives that are not designated
as hedges are recorded in earnings each period. As discussed
above, these derivatives are typically entered into as economic
hedges of changes in interest rates, currency exchange rates,
commodity prices and other risks. Gains or losses related to the
derivative are recorded in predefined captions in the Statement
of Earnings, typically “GECS revenues from services” or “Other
income,” based on our accounting policy. In general, the earnings
effects of the item that represent the economic risk exposure
are recorded in the same caption as the derivative. Gains for 2009
on derivatives not designated as hedges were $1,018 million
and related to interest rate contracts of $208 million, currency
exchange contracts of $499 million, and commodity derivatives
and other of $311 million. The vast majority of the $1,018 million
was offset by the earnings effects from the underlying items that
were economically hedged.
Counterparty credit risk
Fair values of our derivatives can change significantly from period
to period based on, among other factors, market movements and
changes in our positions. Accordingly, we actively monitor these
exposures and take appropriate actions in response. We man-
age counterparty credit risk (the risk that counterparties will
default and not make payments to us according to the terms of
our standard master agreements) on an individual counterparty
basis. Where we have agreed to netting of derivative exposures
with a counterparty, we offset our exposures with that counter-
party and apply the value of collateral posted to us to determine
the exposure. When net exposure to a counterparty, based on
the current market values of agreements and collateral, exceeds
credit exposure limits (see following table), we typically take action
to reduce such exposures. These actions may include prohibiting
additional transactions with the counterparty, requiring additional
collateral from the counterparty (as described below) and termi-
nating or restructuring transactions.
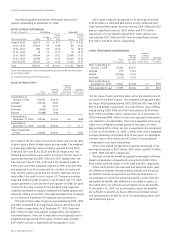
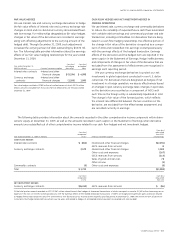
As discussed above, we have provisions in certain of our
master agreements that require counterparties to post collateral
(typically, cash or U.S. Treasuries) when our receivable due from
the counterparty, measured at current market value, exceeds a
specified limit. At December 31, 2009, our exposure to counter-
parties, net of collateral we hold, was $1,196 million. The fair
value of such collateral was $8,454 million, of which $2,387 mil-
lion was cash and $6,067 million was in the form of securities
held by a custodian for our benefit. Under certain of these same
agreements, we post collateral to our counterparties for our
derivative obligations, the fair value of which was $1,855 million
at December 31, 2009.
Following is GECS policy relating to initial credit rating
requirements and to exposure limits to counterparties.
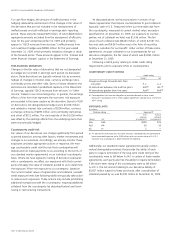
COUNTERPARTY CREDIT CRITERIA
Credit rating
Moody’s S&P
Foreign exchange forwards (less than
one year) P–1 A–1
All derivatives between one and five years Aa3 (a) AA– (a)
All derivatives greater than five years Aaa (a) AAA (a)
(a) Counterparties that have an obligation to provide collateral to cover credit
exposure in accordance with a credit support agreement typically have a minimum
A3/A– rating.
EXPOSURE LIMITS
(In millions)
Minimum rating Exposure (a)
Moody’s S&P
With
collateral
arrangements
Without
collateral
arrangements
Aaa AAA $100 $75
Aa3 AA– 50 50
A3 A– 5 —
(a) For derivatives with exposures less than one year, counterparties are permitted to
have unsecured exposure up to $150 million with a minimum rating of A–1/P–1.
Exposure to a counterparty is determined net of collateral.
Additionally, our standard master agreements typically contain
mutual downgrade provisions that provide the ability of each
party to require termination if the long-term credit rating of the
counterparty were to fall below A–/A3. In certain of these master
agreements, each party also has the ability to require termination
if the short-term rating of the counterparty were to fall below
A–1/P–1. The net amount relating to our derivative liability of
$3,657 million subject to these provisions, after consideration of
collateral posted by us, was $1,281 million at December 31, 2009.