GE 2009 Annual Report Download - page 101
Download and view the complete annual report
Please find page 101 of the 2009 GE annual report below. You can navigate through the pages in the report by either clicking on the pages listed below, or by using the keyword search tool below to find specific information within the annual report.
GE 2009 ANNUAL REPORT 99
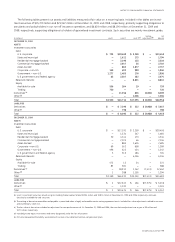
The following tables present our assets and liabilities measured at fair value on a recurring basis. Included in the tables are invest-
ment securities of $25,729 million and $21,967 million at December 31, 2009 and 2008, respectively, primarily supporting obligations to
annuitants and policyholders in our run-off insurance operations, and $6,629 million and $8,190 million at December 31, 2009 and
2008, respectively, supporting obligations to holders of guaranteed investment contracts. Such securities are mainly investment grade.
(In millions) Level 1 Level 2 Level 3 (a) Netting
adjustment (b) Net
balance
DECEMBER 31, 2009
ASSETS
Investment securities
Debt
U.S. corporate $ 723 $19,669 $ 3,258 $ — $23,650
State and municipal — 1,621 173 — 1,794
Residential mortgage-backed — 3,195 123 — 3,318
Commercial mortgage-backed — 2,647 55 — 2,702
Asset-backed — 860 1,877 — 2,737
Corporate — non-U.S. 159 692 989 — 1,840
Government — non-U.S. 1,277 1,483 176 — 2,936
U.S. government and federal agency 85 2,307 282 — 2,674
Retained interests — — 8,831 — 8,831
Equity
Available-for-sale 536 184 19 — 739
Trading 720 — — — 720
Derivatives (c) — 11,056 804 (3,851) 8,009
Other (d) — — 1,006 — 1,006
Total $3,500 $43,714 $17,593 $ (3,851) $60,956
LIABILITIES
Derivatives $ — $ 7,295 $ 222 $ (3,860) $ 3,657
Other (e) — 798 — — 798
Total $ — $ 8,093 $ 222 $ (3,860) $ 4,455
DECEMBER 31, 2008
ASSETS
Investment securities
Debt
U.S. corporate $ — $17,191 $ 3,209 $ — $20,400
State and municipal — 1,234 247 — 1,481
Residential mortgage-backed 30 4,141 173 — 4,344
Commercial mortgage-backed — 2,070 66 — 2,136
Asset-backed — 880 1,605 — 2,485
Corporate — non-U.S. 69 562 658 — 1,289
Government — non-U.S. 496 422 424 — 1,342
U.S. government and federal agency 5 515 184 — 704
Retained interests — — 6,356 — 6,356
Equity
Available-for-sale 475 12 34 — 521
Trading 83 305 — — 388
Derivatives (c) — 18,911 1,142 (7,411) 12,642
Other (d) 1 288 1,105 — 1,394
Total $1,159 $46,531 $15,203 $ (7,411) $55,482
LIABILITIES
Derivatives $ 2 $12,643 $ 166 $ (7,575) $ 5,236
Other (e) — 1,031 — — 1,031
Total $ 2 $13,674 $ 166 $ (7,575) $ 6,267
(a) Level 3 investment securities valued using non-binding broker quotes totaled $1,055 million and $2,074 million at December 31, 2009 and 2008, respectively, and were
classified as available-for-sale securities.
(b) The netting of derivative receivables and payables is permitted when a legally enforceable master netting agreement exists. Included fair value adjustments related to our own
and counterparty credit risk.
(c) The fair value of derivatives included an adjustment for non-performance risk. At December 31, 2009 and 2008, the cumulative adjustment was a gain of $9 million and
$177 million, respectively.
(d) Included private equity investments and loans designated under the fair value option.
(e) Primarily represented the liability associated with certain of our deferred incentive compensation plans.


