GE 2009 Annual Report Download - page 73
Download and view the complete annual report
Please find page 73 of the 2009 GE annual report below. You can navigate through the pages in the report by either clicking on the pages listed below, or by using the keyword search tool below to find specific information within the annual report.-
 1
1 -
2
-
3
-
4
-
5
-
6
-
7
-
8
-
9
-
10
-
11
-
12
-
13
-
14
-
15
-
16
-
17
-
18
-
19
-
20
-
21
-
22
-
23
-
24
-
25
-
26
-
27
-
28
-
29
-
30
-
31
-
32
-
33
-
34
-
35
-
36
-
37
-
38
-
39
-
40
-
41
-
42
-
43
-
44
-
45
-
46
-
47
-
48
-
49
-
50
-
51
-
52
-
53
-
54
-
55
-
56
-
57
-
58
-
59
-
60
-
61
-
62
-
 63
63 -
 64
64 -
 65
65 -
 66
66 -
 67
67 -
 68
68 -
 69
69 -
 70
70 -
 71
71 -
 72
72 -
 73
73 -
 74
74 -
 75
75 -
 76
76 -
 77
77 -
 78
78 -
 79
79 -
 80
80 -
 81
81 -
 82
82 -
 83
83 -
84
-
85
-
86
-
87
-
88
-
89
-
90
-
91
-
92
-
93
-
94
-
95
-
96
-
97
-
98
-
99
-
100
-
101
-
102
-
103
-
104
-
105
-
106
-
107
-
108
-
109
-
110
-
111
-
112
-
113
-
114
-
115
-
116
-
117
-
118
-
119
-
120
-
121
-
122
-
123
-
124
 |
 |
GE 2009 ANNUAL REPORT 71
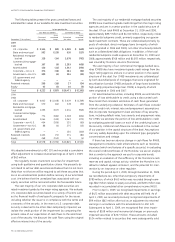
Annually, we conduct reviews of our primary pricing vendor
to validate that the inputs used in that vendor’s pricing process
are deemed to be market observable as defined in the standard.
While we were not provided access to proprietary models of
the vendor, our reviews have included on-site walk-throughs of
the pricing process, methodologies and control procedures for
each asset class and level for which prices are provided. Our
review also included an examination of the underlying inputs and
assumptions for a sample of individual securities across asset
classes, credit rating levels and various durations, a process we
continue to perform for each reporting period. In addition, the
pricing vendor has an established challenge process in place for
all security valuations, which facilitates identification and resolu-
tion of potentially erroneous prices. We believe that the prices
received from our pricing vendor are representative of prices that
would be received to sell the assets at the measurement date
(exit prices) and are classified appropriately in the hierarchy.
We use non-binding broker quotes as our primary basis for
valuation when there is limited, or no, relevant market activity for
a specific instrument or for other instruments that share similar
characteristics. We have not adjusted the prices we have obtained.
Investment securities priced using non-binding broker quotes
are included in Level 3. As is the case with our primary pricing
vendor, third-party brokers do not provide access to their propri-
etary valuation models, inputs and assumptions. Accordingly, our
risk management personnel conduct internal reviews of pricing
for all such investment securities quarterly to ensure reasonable-
ness of valuations used in our financial statements. These reviews
are designed to identify prices that appear stale, those that have
changed significantly from prior valuations, and other anomalies
that may indicate that a price may not be accurate. Based on the
information available, we believe that the fair values provided
by the brokers are representative of prices that would be received
to sell the assets at the measurement date (exit prices).
Retained interests in securitizations are valued using a dis-
counted cash flow model that considers the underlying structure
of the securitization and estimated net credit exposure, prepay-
ment assumptions, discount rates and expected life.
DERIVATIVES. We use closing prices for derivatives included in
Level 1, which are traded either on exchanges or liquid over-the-
counter markets.
The majority of our derivatives are valued using internal models.
The models maximize the use of market observable inputs
including interest rate curves and both forward and spot prices
for currencies and commodities. Derivative assets and liabilities
included in Level 2 primarily represent interest rate swaps, cross-
currency swaps and foreign currency and commodity forward
and option contracts.
Derivative assets and liabilities included in Level 3 primarily
represent interest rate products that contain embedded option-
ality or prepayment features.
Non-Recurring Fair Value Measurements
Certain assets are measured at fair value on a non-recurring
basis. These assets are not measured at fair value on an ongoing
basis, but are subject to fair value adjustments only in certain
circumstances. These assets can include loans and long-lived
assets that have been reduced to fair value when they are held
for sale, impaired loans that have been reduced based on the
fair value of the underlying collateral, cost and equity method
investments and long-lived assets that are written down to fair
value when they are impaired and the remeasurement of retained
investments in formerly consolidated subsidiaries upon a change
in control that results in deconsolidation of a subsidiary, if we
sell a controlling interest and retain a noncontrolling stake in the
entity. Assets that are written down to fair value when impaired
and retained investments are not subsequently adjusted to fair
value unless further impairment occurs.
The following describes the valuation methodologies we use
to measure financial and non-financial instruments accounted for
at fair value on a non-recurring basis and for assets within our
pension plans and retiree benefit plans at each reporting period,
as applicable.
LOANS. When available, we use observable market data, including
pricing on recent closed market transactions, to value loans that
are included in Level 2. When this data is unobservable, we use
valuation methodologies using current market interest rate data
adjusted for inherent credit risk, and such loans are included in
Level 3. When appropriate, loans are valued using collateral values
as a practical expedient.
COST AND EQUITY METHOD INVESTMENTS are valued using market
observable data such as quoted prices when available. When
market observable data is unavailable, investments are valued
using a discounted cash flow model, comparative market multiples
or a combination of both approaches as appropriate. These invest-
ments are generally included in Level 3.
Investments in private equity, real estate and collective funds
are valued using net asset values. The net asset values are deter-
mined based on the fair values of the underlying investments in
the funds. Investments in private equity and real estate funds
are generally included in Level 3 because they are not redeem-
able at the measurement date. Investments in collective funds
are included in Level 2.
LONG-LIVED ASSETS, including aircraft and real estate, are valued
using the best information available, including quoted market
prices or market prices for similar assets when available or internal
cash flow estimates discounted at an appropriate interest rate
or independent appraisals, as appropriate. For real estate, cash
flow estimates are based on current market estimates that
reflect current and projected lease profiles and available industry
information about expected trends in rental, occupancy and
capitalization rates. These investments are generally included in
Level 3.