GE 2009 Annual Report Download - page 92
Download and view the complete annual report
Please find page 92 of the 2009 GE annual report below. You can navigate through the pages in the report by either clicking on the pages listed below, or by using the keyword search tool below to find specific information within the annual report.-
 1
1 -
2
-
3
-
4
-
5
-
6
-
7
-
8
-
9
-
10
-
11
-
12
-
13
-
14
-
15
-
16
-
17
-
18
-
19
-
20
-
21
-
22
-
23
-
24
-
25
-
26
-
27
-
28
-
29
-
30
-
31
-
32
-
33
-
34
-
35
-
36
-
37
-
38
-
39
-
40
-
41
-
42
-
43
-
44
-
45
-
46
-
47
-
48
-
49
-
50
-
51
-
52
-
53
-
54
-
55
-
56
-
57
-
58
-
59
-
60
-
61
-
62
-
63
-
64
-
65
-
66
-
67
-
68
-
69
-
70
-
71
-
72
-
73
-
74
-
75
-
76
-
77
-
78
-
79
-
80
-
81
-
 82
82 -
 83
83 -
 84
84 -
 85
85 -
 86
86 -
 87
87 -
 88
88 -
 89
89 -
 90
90 -
 91
91 -
 92
92 -
 93
93 -
 94
94 -
 95
95 -
 96
96 -
 97
97 -
 98
98 -
 99
99 -
 100
100 -
 101
101 -
 102
102 -
103
-
104
-
105
-
106
-
107
-
108
-
109
-
110
-
111
-
112
-
113
-
114
-
115
-
116
-
117
-
118
-
119
-
120
-
121
-
122
-
123
-
124
 |
 |

90 GE 2009 ANNUAL REPORT
Plan fiduciaries set investment policies and strategies for the
trust and oversee its investment allocation, which includes
selecting investment managers and setting long-term strategic
targets. Long-term strategic investment objectives include pre-
serving the funded status of the plan and balancing risk and
return. Target allocation percentages are established at an asset
class level by plan fiduciaries. Target allocation ranges are guide-
lines, not limitations, and occasionally plan fiduciaries will
approve allocations above or below a target range.
Trust assets invested in short-term securities must generally
be invested in securities rated A1/P1 or better, except for 15%
of such securities that may be rated A2/P2. According to statute,
the aggregate holdings of all qualifying employer securities
(e.g., GE common stock) and qualifying employer real property
may not exceed 10% of the fair value of trust assets at the time
of purchase. GE securities represented 3.7% and 3.6% of trust
assets at year-end 2009 and 2008, respectively.
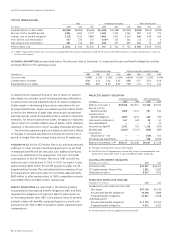
As of December 31, 2009, retiree benefit plans’ assets were
$1,138 million. U.S. and non-U.S. equity securities amounting to
$315 million and $237 million, respectively, fixed income and cash
investment funds amounting to $214 million and other debt securi-
ties amounting to $193 million represented approximately 80% of
total investments as of December 31, 2009. The plans’ investments
were classified as 42% Level 1, 37% Level 2 and 21% Level 3. The
Level 3 investments primarily represented investments in private
equities and real estate. The changes in Level 3 investments were
insignificant for the year ended December 31, 2009.
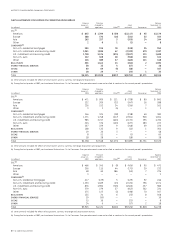
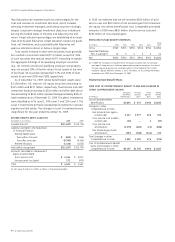
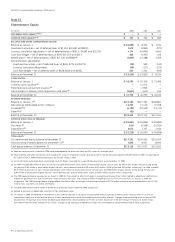
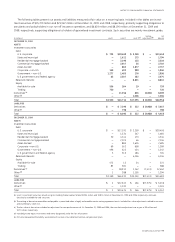
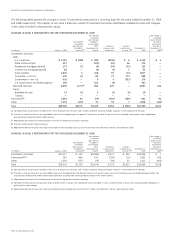
RETIREE BENEFIT ASSET (LIABILITY)
December 31 (In millions) 2009 2008
Funded status (a) $(11,637) $ (10,774)
Liability recorded in the Statement
of Financial Position
Retiree health plans
Due within one year $ (691) $ (644)
Due after one year (9,790) (9,105)
Retiree life plans (1,156) (1,025)
Net liability recognized $(11,637) $ (10,774)
Amounts recorded in shareowners’
equity (unamortized)
Prior service cost $ 4,154 $ 5,027
Net actuarial loss (gain) 272 (475)
Total $ 4,426 $ 4,552
(a) Fair value of assets less APBO, as shown in the preceding tables.
In 2010, we estimate that we will amortize $630 million of prior
service cost and $20 million of net actuarial gain from shareown-
ers’ equity into retiree benefit plans cost. Comparable amortized
amounts in 2009 were $836 million of prior service cost and
$225 million of net actuarial gains.
ESTIMATED FUTURE BENEFIT PAYMENTS
(In millions) 2010 2011 2012 2013 2014
2015
2019
–
Gross $960 $925 $930 $945 $950 $4,850
Expected Medicare
Part D subsidy (a) 70 5 5 5 5 20
Net $890 $920 $925 $940 $945 $4,830
(a) In 2009, the Company contracted with a third party to administer our principal
post-age 65 drug plan as a Medicare-approved prescription drug plan. As a result,
this post-age 65 drug plan will no longer qualify for the Medicare Part D direct
employer subsidy effective January 1, 2011. The effects of this change have been
included in our APBO as of December 31, 2009.
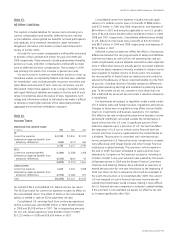
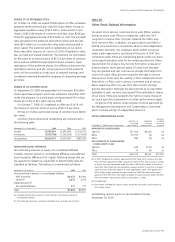
Postretirement Benefit Plans
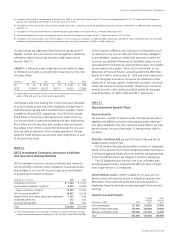
2009 COST OF POSTRETIREMENT BENEFIT PLANS AND CHANGES IN
OTHER COMPREHENSIVE INCOME
(In millions)
Total post
retirement
benefit plans
-
Principal
pension
plans
Other
pension
plans
Retiree
benefit
plans
Cost of postretirement
benefit plans $2,644 $ 547 $ 464 $1,633
Changes in other
comprehensive income
Net actuarial loss (gain) —
current year 3,117 1,977 618 522
Prior service cost (credit) —
current year (34) — 3 (37)
Prior service cost
amortization (1,273) (426) (11) (836)
Net actuarial gain (loss)
amortization (257) (348) (134) 225
Total changes in other
comprehensive income 1,553 1,203 476 (126)
Cost of postretirement benefit
plans and changes in other
comprehensive income $4,197 $1,750 $ 940 $1,507