GE 2009 Annual Report Download - page 88
Download and view the complete annual report
Please find page 88 of the 2009 GE annual report below. You can navigate through the pages in the report by either clicking on the pages listed below, or by using the keyword search tool below to find specific information within the annual report.-
 1
1 -
2
-
3
-
4
-
5
-
6
-
7
-
8
-
9
-
10
-
11
-
12
-
13
-
14
-
15
-
16
-
17
-
18
-
19
-
20
-
21
-
22
-
23
-
24
-
25
-
26
-
27
-
28
-
29
-
30
-
31
-
32
-
33
-
34
-
35
-
36
-
37
-
38
-
39
-
40
-
41
-
42
-
43
-
44
-
45
-
46
-
47
-
48
-
49
-
50
-
51
-
52
-
53
-
54
-
55
-
56
-
57
-
58
-
59
-
60
-
61
-
62
-
63
-
64
-
65
-
66
-
67
-
68
-
69
-
70
-
71
-
72
-
73
-
74
-
75
-
76
-
77
-
 78
78 -
 79
79 -
 80
80 -
 81
81 -
 82
82 -
 83
83 -
 84
84 -
 85
85 -
 86
86 -
 87
87 -
 88
88 -
 89
89 -
 90
90 -
 91
91 -
 92
92 -
 93
93 -
 94
94 -
 95
95 -
 96
96 -
 97
97 -
 98
98 -
99
-
100
-
101
-
102
-
103
-
104
-
105
-
106
-
107
-
108
-
109
-
110
-
111
-
112
-
113
-
114
-
115
-
116
-
117
-
118
-
119
-
120
-
121
-
122
-
123
-
124
 |
 |

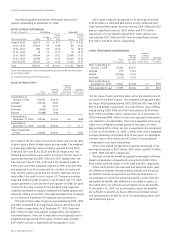
86 GE 2009 ANNUAL REPORT
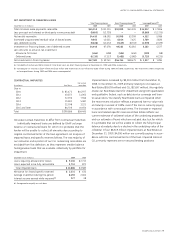
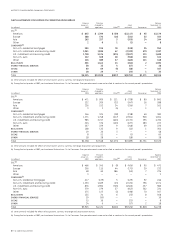
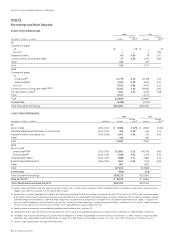
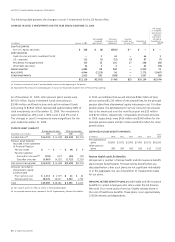
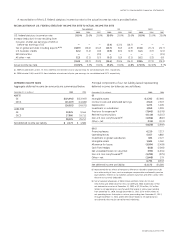
COST OF PENSION PLANS
Total Principal pension plans Other pension plans
(In millions) 2009 2008 2007 2009 2008 2007 2009 2008 2007
Expected return on plan assets $(4,943) $(4,850) $(4,459) $(4,505) $ (4,298) $ (3,950) $(438) $ (552) $(509)
Service cost for benefits earned 1,906 1,663 1,727 1,609 1,331 1,355 297 332 372
Interest cost on benefit obligation 3,129 3,152 2,885 2,669 2,653 2,416 460 499 469
Prior service cost amortization 437 332 247 426
(a) 321 241 11 11 6
Net actuarial loss amortization 482 316 856 348 237 693 134 79 163
Pension plans cost $ 1,011 $ 613 $ 1,256 $ 547 $ 244 $ 755 $ 464 $ 369 $ 501
(a) In 2009, included a $103 million loss as a result of our agreement with Comcast Corporation to transfer the assets of the NBCU business to a newly formed entity in which we
will own a 49% interest.
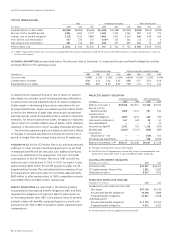
ACTUARIAL ASSUMPTIONS are described below. The discount rates at December 31 measured the year-end benefit obligations and the
earnings effects for the subsequent year.
Principal pension plans Other pension plans (weighted average)
December 31 2009 2008 2007 2006 2009 2008 2007 2006
Discount rate 5.78 % 6.11 % 6.34 % 5.75 % 5.31 % 6.03 % 5.65 % 4.97 %
Compensation increases 4.20 4.20 5.00 5.00 4.56 4.47 4.50 4.26
Expected return on assets 8.50 8.50 8.50 8.50 7.29 7.41 7.51 7.44
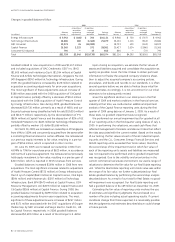
To determine the expected long-term rate of return on pension
plan assets, we consider current and expected asset allocations,
as well as historical and expected returns on various categories
of plan assets. In developing future return expectations for our
principal benefit plans’ assets, we evaluate general market trends
as well as key elements of asset class returns such as expected
earnings growth, yields and spreads across a number of potential
scenarios. For the principal pension plans, we apply our expected
rate of return to a market-related value of assets, which stabilizes
variability in the amounts to which we apply that expected return.
We amortize experience gains and losses as well as the effects
of changes in actuarial assumptions and plan provisions over a
period no longer than the average future service of employees.
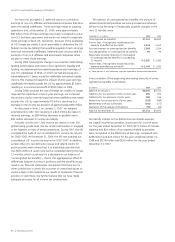
FUNDING POLICY for the GE Pension Plan is to contribute amounts
sufficient to meet minimum funding requirements as set forth
in employee benefit and tax laws plus such additional amounts
as we may determine to be appropriate. We have not made
contributions to the GE Pension Plan since 1987 and will not
make any such contributions in 2010. In 2010, we expect to pay
approximately $190 million for benefit payments under our GE
Supplementary Pension Plan and administrative expenses of our
principal pension plans and expect to contribute approximately
$600 million to other pension plans. In 2009, comparative amounts
were $168 million and $676 million, respectively.
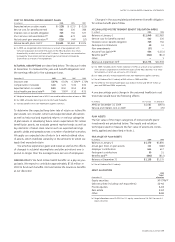
BENEFIT OBLIGATIONS are described in the following tables.
Accumulated and projected benefit obligations (ABO and PBO)
represent the obligations of a pension plan for past service as
of the measurement date. ABO is the present value of benefits
earned to date with benefits computed based on current com-
pensation levels. PBO is ABO increased to reflect expected future
compensation.
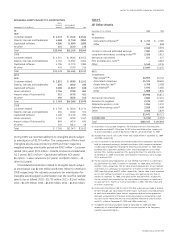
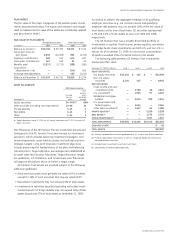
PROJECTED BENEFIT OBLIGATION
Principal pension plans Other pension plans
(In millions) 2009 2008 2009 2008
Balance at January 1 $45,168 $42,947 $7,748 $ 9,014
Service cost for
benefits earned 1,609 1,331 297 332
Interest cost on
benefit obligations 2,669 2,653 460 499
Participant contributions 167 169 35 40
Plan amendments — — 3 16
Actuarial loss (gain) (a) 1,331 791 1,113 (923)
Benefits paid (2,827) (2,723) (398) (383)
Acquisitions
(dispositions) — net — — (219) 545
Exchange rate adjustments — — 558 (1,392)
Balance at December 31 (b) $48,117 $45,168 $9,597 $ 7,748
(a) Principally associated with discount rate changes.
(b) The PBO for the GE Supplementary Pension Plan, which is an unfunded plan, was
$3,828 million and $3,505 million at year-end 2009 and 2008, respectively.
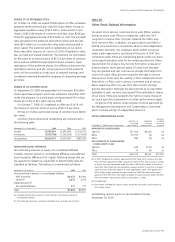
ACCUMULATED BENEFIT OBLIGATION
December 31 (In millions) 2009 2008
GE Pension Plan $42,917 $40,313
GE Supplementary Pension Plan 2,901 2,582
Other pension plans 8,947 7,075
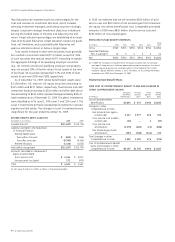
PLANS WITH ASSETS LESS THAN ABO
December 31 (In millions) 2009 2008
Funded plans with assets less than ABO
Plan assets $47,740 $ 4,914
Accumulated benefit obligations 49,948 5,888
Projected benefit obligations 51,837 6,468
Unfunded plans (a)
Accumulated benefit obligations $ 3,725 $3,352
Projected benefit obligations 4,675 4,303
(a) Primarily related to the GE Supplementary Pension Plan.