GE 2009 Annual Report Download - page 98
Download and view the complete annual report
Please find page 98 of the 2009 GE annual report below. You can navigate through the pages in the report by either clicking on the pages listed below, or by using the keyword search tool below to find specific information within the annual report.-
 1
1 -
2
-
3
-
4
-
5
-
6
-
7
-
8
-
9
-
10
-
11
-
12
-
13
-
14
-
15
-
16
-
17
-
18
-
19
-
20
-
21
-
22
-
23
-
24
-
25
-
26
-
27
-
28
-
29
-
30
-
31
-
32
-
33
-
34
-
35
-
36
-
37
-
38
-
39
-
40
-
41
-
42
-
43
-
44
-
45
-
46
-
47
-
48
-
49
-
50
-
51
-
52
-
53
-
54
-
55
-
56
-
57
-
58
-
59
-
60
-
61
-
62
-
63
-
64
-
65
-
66
-
67
-
68
-
69
-
70
-
71
-
72
-
73
-
74
-
75
-
76
-
77
-
78
-
79
-
80
-
81
-
82
-
83
-
84
-
85
-
86
-
87
-
 88
88 -
 89
89 -
 90
90 -
 91
91 -
 92
92 -
 93
93 -
 94
94 -
 95
95 -
 96
96 -
 97
97 -
 98
98 -
 99
99 -
 100
100 -
 101
101 -
 102
102 -
 103
103 -
 104
104 -
 105
105 -
 106
106 -
 107
107 -
 108
108 -
109
-
110
-
111
-
112
-
113
-
114
-
115
-
116
-
117
-
118
-
119
-
120
-
121
-
122
-
123
-
124
 |
 |

96 GE 2009 ANNUAL REPORT
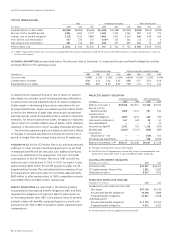
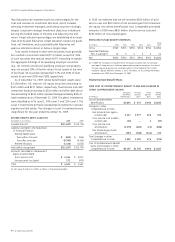
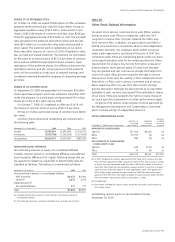
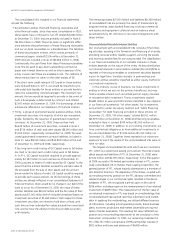
The following table summarizes information about stock
options outstanding at December 31, 2009.
STOCK OPTIONS OUTSTANDING
(Shares in thousands) Outstanding Exercisable
Exercise price range Shares
Average
life (a)
Average
exercise
price Shares
Average
exercise
price
Under $10.00 68,673 9.2 $ 9.57 127 $ 9.57
10.01–15.00 87,600 9.5 11.98 89 11.53
15.01–20.00 896 9.5 16.19 76 18.72
20.01–25.00 78 2.3 22.73 78 22.73
25.01–30.00 49,604 5.4 27.62 31,968 27.27
30.01–35.00 50,899 5.1 33.19 43,469 33.05
Over $35.00 80,413 2.4 43.18 71,546 43.74
Total 338,163 6.5 $24.41 147,353 $36.94
At year-end 2008, options with an average exercise price of $37.59 were exercisable
on 162 million shares.
(a) Average contractual life remaining in years.
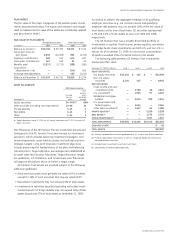
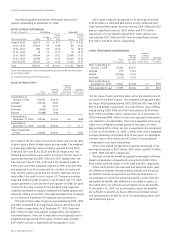
STOCK OPTION ACTIVITY
Shares
(In thousands)
Weighted
average
exercise price
Weighted
average
remaining
contractual
term (In years)
Aggregate
intrinsic value
(In millions)
Outstanding at
January 1, 2009 215,507 $36.30
Granted 159,226 10.93
Exercised (13) 10.21
Forfeited (4,669) 21.44
Expired (31,888) 37.88
Outstanding at
December 31, 2009 338,163 $24.41 6.5 $658
Exercisable at
December 31, 2009 147,353 $36.94 3.1 $ 1
Options expected
to vest 165,805 $14.93 9.1 $565
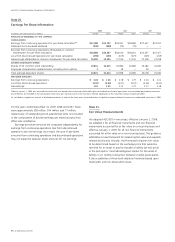
We measure the fair value of each stock option grant at the date
of grant using a Black-Scholes option pricing model. The weighted
average grant-date fair value of options granted during 2009,
2008 and 2007 was $3.81, $5.26 and $9.28, respectively. The
following assumptions were used in arriving at the fair value of
options granted during 2009, 2008 and 2007, respectively: risk-
free interest rates of 3.2%, 3.4% and 4.2%; dividend yields of
3.9%, 4.4% and 2.9%; expected volatility of 49%, 27% and 25%;
and expected lives of six years and ten months, six years and
nine months, and six years and ten months. Risk-free interest
rates reflect the yield on zero-coupon U.S. Treasury securities.
Expected dividend yields presume a set dividend rate. For stock
options granted in 2009 and the fourth quarter of 2008, we used
a historical five-year average for the dividend yield. Expected
volatilities are based on implied volatilities from traded options and
historical volatility of our stock. The expected option lives are based
on our historical experience of employee exercise behavior.
The total intrinsic value of options exercised during 2009, 2008
and 2007 amounted to an insignificant amount, $45 million and
$375 million, respectively. As of December 31, 2009, there was
$597 million of total unrecognized compensation cost related to
nonvested options. That cost is expected to be recognized over a
weighted average period of two years, of which approximately
$191 million, pre tax, is expected to be recognized in 2010.
Stock option expense recognized in net earnings amounted
to $120 million in 2009 and $69 million in both 2008 and 2007.
Cash received from option exercises during 2009, 2008 and 2007
was an insignificant amount, $353 million and $747 million,
respectively. The tax benefit realized from stock options exer-
cised during 2009, 2008 and 2007 was an insignificant amount,
$15 million and $131 million, respectively.
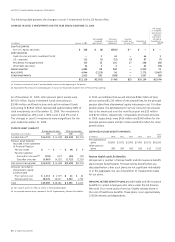
OTHER STOCK-BASED COMPENSATION
Shares
(In thousands)
Weighted
average
grant date
fair value
Weighted
average
remaining
contractual
term (In years)
Aggregate
intrinsic value
(In millions)
RSUs outstanding at
January 1, 2009 36,483 $32.57
Granted 674 13.63
Vested (10,064) 32.76
Forfeited (1,232) 32.91
RSUs outstanding at
December 31, 2009 25,861 $31.98 2.7 $391
RSUs expected to vest 23,599 $32.04 2.6 $357
The fair value of each restricted stock unit is the market price of
our stock on the date of grant. The weighted average grant date
fair value of RSUs granted during 2009, 2008 and 2007 was $13.63,
$28.74 and $38.84, respectively. The total intrinsic value of RSUs
vested during 2009, 2008 and 2007 amounted to $139 million,
$274 million and $181 million, respectively. As of December 31,
2009, there was $482 million of total unrecognized compensation
cost related to nonvested RSUs. That cost is expected to be recog-
nized over a weighted average period of two years, of which
approximately $174 million, pre tax, is expected to be recognized
in 2010. As of December 31, 2009, 1 million PSUs with a weighted
average remaining contractual term of two years, an aggregate
intrinsic value of $14 million and $7 million of unrecognized
compensation cost were outstanding.
Other share-based compensation expense recognized in net
earnings amounted to $127 million, $155 million and $173 million
in 2009, 2008 and 2007, respectively.
The total income tax benefit recognized in earnings for all share-
based compensation arrangements amounted to $118 million,
$106 million and $118 million in 2009, 2008 and 2007, respectively.
When stock options are exercised and restricted stock vests,
the difference between the assumed tax benefit and the actual
tax benefit must be recognized in our financial statements. In
circumstances in which the actual tax benefit is lower than the
estimated tax benefit, that difference is recorded in equity, to
the extent there are sufficient accumulated excess tax benefits.
At December 31, 2009, our accumulated excess tax benefits
are sufficient to absorb any future differences between actual
and estimated tax benefits for all of our outstanding option and
restricted stock grants.