Dell 2003 Annual Report Download - page 55
Download and view the complete annual report
Please find page 55 of the 2003 Dell annual report below. You can navigate through the pages in the report by either clicking on the pages listed below, or by using the keyword search tool below to find specific information within the annual report.-
 1
1 -
2
-
3
-
4
-
5
-
6
-
7
-
8
-
9
-
10
-
11
-
12
-
13
-
14
-
15
-
16
-
17
-
18
-
19
-
20
-
21
-
22
-
23
-
24
-
25
-
26
-
27
-
28
-
29
-
30
-
31
-
32
-
33
-
34
-
35
-
36
-
37
-
38
-
39
-
40
-
41
-
42
-
43
-
44
-
 45
45 -
 46
46 -
 47
47 -
 48
48 -
 49
49 -
 50
50 -
 51
51 -
 52
52 -
 53
53 -
 54
54 -
 55
55 -
 56
56 -
 57
57 -
 58
58 -
 59
59 -
 60
60 -
 61
61 -
 62
62 -
 63
63 -
 64
64 -
 65
65 -
66
-
67
-
68
-
69
-
70
-
71
-
72
-
73
-
74
-
75
-
76
-
77
-
78
-
79
-
80
-
81
-
82
-
83
-
84
-
85
-
86
-
87
-
88
-
89
-
90
-
91
-
92
-
93
-
94
-
95
-
96
-
97
-
98
-
99
-
100
-
101
-
102
-
103
-
104
-
105
-
106
-
107
-
108
-
109
-
110
-
111
-
112
-
113
-
114
-
115
-
116
-
117
-
118
-
119
-
120
-
121
-
122
-
123
-
124
-
125
-
126
-
127
-
128
-
129
-
130
-
131
-
132
-
133
-
134
-
135
-
136
-
137
-
138
-
139
-
140
-
141
-
142
-
143
-
144
-
145
-
146
-
147
-
148
-
149
-
150
-
151
-
152
-
153
-
154
-
155
-
156
-
157
-
158
-
159
-
160
-
161
-
162
-
163
-
164
-
165
-
166
-
167
-
168
-
169
-
170
-
171
-
172
-
173
-
174
 |
 |

Table of Contents
Fiscal Year Ended
January 30, January 31, February 1,
2004 2003 2002
(in millions)
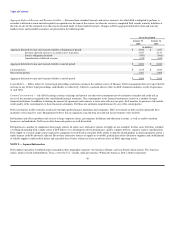
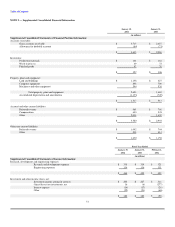
Supplemental Consolidated Statements of Cash Flows Information:
Changes in operating working capital accounts:
Accounts receivable, net $ (813) $ 190 $ 222
Inventories (53) (21) 111
Accounts payable 1,283 844 826
Accrued and other liabilities 867 585 (210)
Other, net (412) (388) (123)
$ 872 $ 1,210 $ 826
Income taxes paid $ 699 $ 607 $ 120
Interest paid $ 30 $ 20 $ 31
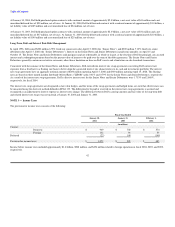
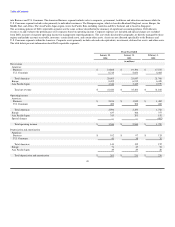
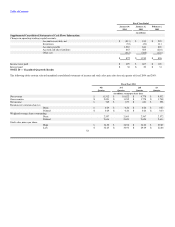
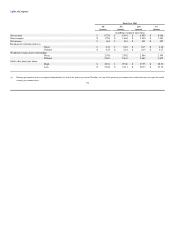
NOTE 10 — Unaudited Quarterly Results
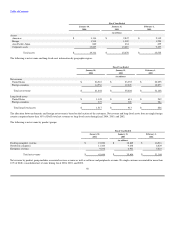
The following tables contain selected unaudited consolidated statements of income and stock sales price data for each quarter of fiscal 2004 and 2003:
Fiscal Year 2004
4th 3rd 2nd 1st
Quarter Quarter Quarter Quarter
(in millions, except per share data)
Net revenue $ 11,512 $ 10,622 $ 9,778 $ 9,532
Gross margin $ 2,091 $ 1,935 $ 1,778 $ 1,748
Net income $ 749 $ 677 $ 621 $ 598
Earnings per common share(a):
Basic $ 0.29 $ 0.26 $ 0.24 $ 0.23
Diluted $ 0.29 $ 0.26 $ 0.24 $ 0.23
Weighted average shares outstanding:
Basic 2,557 2,563 2,567 2,572
Diluted 2,616 2,623 2,624 2,614
Stock sales prices per share:
High $ 36.52 $ 36.98 $ 34.00 $ 29.89
Low $ 32.65 $ 30.94 $ 29.49 $ 22.86
52