Dell 2003 Annual Report Download - page 54
Download and view the complete annual report
Please find page 54 of the 2003 Dell annual report below. You can navigate through the pages in the report by either clicking on the pages listed below, or by using the keyword search tool below to find specific information within the annual report.-
 1
1 -
2
-
3
-
4
-
5
-
6
-
7
-
8
-
9
-
10
-
11
-
12
-
13
-
14
-
15
-
16
-
17
-
18
-
19
-
20
-
21
-
22
-
23
-
24
-
25
-
26
-
27
-
28
-
29
-
30
-
31
-
32
-
33
-
34
-
35
-
36
-
37
-
38
-
39
-
40
-
41
-
42
-
43
-
 44
44 -
 45
45 -
 46
46 -
 47
47 -
 48
48 -
 49
49 -
 50
50 -
 51
51 -
 52
52 -
 53
53 -
 54
54 -
 55
55 -
 56
56 -
 57
57 -
 58
58 -
 59
59 -
 60
60 -
 61
61 -
 62
62 -
 63
63 -
 64
64 -
65
-
66
-
67
-
68
-
69
-
70
-
71
-
72
-
73
-
74
-
75
-
76
-
77
-
78
-
79
-
80
-
81
-
82
-
83
-
84
-
85
-
86
-
87
-
88
-
89
-
90
-
91
-
92
-
93
-
94
-
95
-
96
-
97
-
98
-
99
-
100
-
101
-
102
-
103
-
104
-
105
-
106
-
107
-
108
-
109
-
110
-
111
-
112
-
113
-
114
-
115
-
116
-
117
-
118
-
119
-
120
-
121
-
122
-
123
-
124
-
125
-
126
-
127
-
128
-
129
-
130
-
131
-
132
-
133
-
134
-
135
-
136
-
137
-
138
-
139
-
140
-
141
-
142
-
143
-
144
-
145
-
146
-
147
-
148
-
149
-
150
-
151
-
152
-
153
-
154
-
155
-
156
-
157
-
158
-
159
-
160
-
161
-
162
-
163
-
164
-
165
-
166
-
167
-
168
-
169
-
170
-
171
-
172
-
173
-
174
 |
 |

Table of Contents
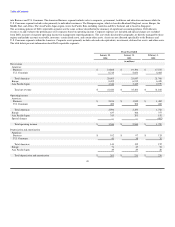
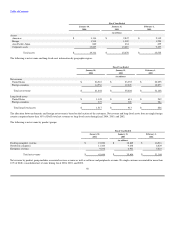
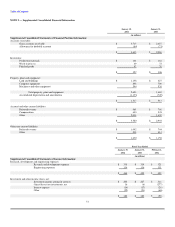
NOTE 9 — Supplemental Consolidated Financial Information
January 30, January 31,
2004 2003
(in millions)
Supplemental Consolidated Statements of Financial Position Information:
Accounts receivable:
Gross accounts receivable $ 3,719 $ 2,657
Allowance for doubtful accounts (84) (71)
$ 3,635 $ 2,586
Inventories:
Production materials $ 161 $ 164
Work-in-process 69 72
Finished goods 97 70
$ 327 $ 306
Property, plant and equipment:
Land and buildings $ 1,158 $ 427
Computer equipment 898 709
Machinery and other equipment 594 526
Total property, plant and equipment 2,650 1,662
Accumulated depreciation and amortization (1,133) (749)
$ 1,517 $ 913
Accrued and other current liabilities:
Deferred revenue $ 961 $ 760
Compensation 603 545
Other 2,016 1,639
$ 3,580 $ 2,944
Other non-current liabilities:
Deferred revenue $ 1,092 $ 744
Other 538 414
$ 1,630 $ 1,158
Fiscal Year Ended
January 30, January 31, February 1,
2004 2003 2002
(in millions)
Supplemental Consolidated Statements of Income Information:
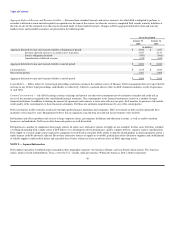
Research, development and engineering expenses:
Research and development expenses $ 330 $ 319 $ 321
Engineering expenses 134 136 131
$ 464 $ 455 $ 452
Investment and other income (loss), net:
Investment income, primarily interest $ 200 $ 227 $ 314
Gains/(losses) on investments, net 16 (6) (277)
Interest expense (14) (17) (29)
Other (22) (21) (66)
$ 180 $ 183 $ (58)
51