Dell 2003 Annual Report Download - page 23
Download and view the complete annual report
Please find page 23 of the 2003 Dell annual report below. You can navigate through the pages in the report by either clicking on the pages listed below, or by using the keyword search tool below to find specific information within the annual report.-
 1
1 -
2
-
3
-
4
-
5
-
6
-
7
-
8
-
9
-
10
-
11
-
12
-
 13
13 -
 14
14 -
 15
15 -
 16
16 -
 17
17 -
 18
18 -
 19
19 -
 20
20 -
 21
21 -
 22
22 -
 23
23 -
 24
24 -
 25
25 -
 26
26 -
 27
27 -
 28
28 -
 29
29 -
 30
30 -
 31
31 -
 32
32 -
 33
33 -
34
-
35
-
36
-
37
-
38
-
39
-
40
-
41
-
42
-
43
-
44
-
45
-
46
-
47
-
48
-
49
-
50
-
51
-
52
-
53
-
54
-
55
-
56
-
57
-
58
-
59
-
60
-
61
-
62
-
63
-
64
-
65
-
66
-
67
-
68
-
69
-
70
-
71
-
72
-
73
-
74
-
75
-
76
-
77
-
78
-
79
-
80
-
81
-
82
-
83
-
84
-
85
-
86
-
87
-
88
-
89
-
90
-
91
-
92
-
93
-
94
-
95
-
96
-
97
-
98
-
99
-
100
-
101
-
102
-
103
-
104
-
105
-
106
-
107
-
108
-
109
-
110
-
111
-
112
-
113
-
114
-
115
-
116
-
117
-
118
-
119
-
120
-
121
-
122
-
123
-
124
-
125
-
126
-
127
-
128
-
129
-
130
-
131
-
132
-
133
-
134
-
135
-
136
-
137
-
138
-
139
-
140
-
141
-
142
-
143
-
144
-
145
-
146
-
147
-
148
-
149
-
150
-
151
-
152
-
153
-
154
-
155
-
156
-
157
-
158
-
159
-
160
-
161
-
162
-
163
-
164
-
165
-
166
-
167
-
168
-
169
-
170
-
171
-
172
-
173
-
174
 |
 |

Table of Contents
Selling, General, and Administrative — During fiscal 2004, selling, general, and administrative expenses remained relatively flat as a percentage of net
revenue, compared to fiscal 2003, but increased in absolute dollars. The increase was mainly due to higher compensation costs and corresponds with the
increase in net revenue as Dell continues to invest in global expansion efforts as part of its strategy to profitably gain market share. Selling, general, and
administrative expenses decreased as a percentage of revenue to 8.6% in fiscal 2003, as compared to 8.9% in fiscal 2002, primarily due to Dell's previously
discussed cost saving initiatives and managing expenses relative to revenue growth.
Research, Development, and Engineering — Dell continues to invest in research, development, and engineering activities to develop and introduce new
products. During fiscal 2004, research, development, and engineering expenses decreased slightly as a percentage of net revenue, compared to fiscal 2003 and
2002. The efficiencies are a result of Dell's continued leverage of its streamlined infrastructure and strategic relationships with its vendor partners. Dell
expects to continue to invest in research, development, and engineering activity and has received 980 U.S. patents and applied for an additional 629 patents as
of January 30, 2004.
Special Charges — During fiscal 2002, Dell reduced its workforce and exited certain activities to align its cost structure with ongoing economic and industry
conditions. Special charges of $482 million related to this action were recorded in operating expenses in the second quarter of fiscal 2002 and included the
elimination of approximately 4,000 employee positions worldwide from various business functions and job classes. As of January 30, 2004 and January 31,
2003, substantially all accrued costs related to the $482 million in special charges had been paid.
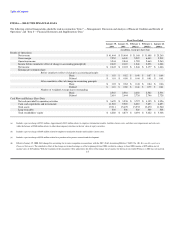
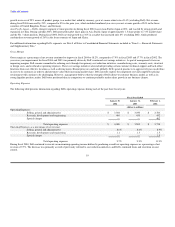
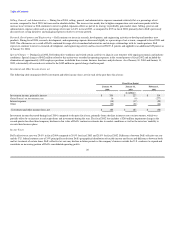
Investment and Other Income (Loss), net
The following table summarizes Dell's investment and other income (loss), net for each of the past three fiscal years:
Fiscal Year Ended
January 30, January 31, February 1,
2004 2003 2002
(in millions)
Investment income, primarily interest $ 200 $ 227 $ 314
Gains/(losses) on investments, net 16 (6) (277)
Interest expense (14) (17) (29)
Other (22) (21) (66)
Investment and other income (loss), net $ 180 $ 183 $ (58)
Investment income decreased during fiscal 2004, compared to the prior fiscal year, primarily from a decline in interest rates on investments, which was
partially offset by an increase in cash equivalents and investments during the year. The fiscal 2002 loss includes a $260 million impairment charge in the
second quarter for other-than-temporary declines in fair value of Dell's venture investments due to market conditions as well as the investees' inability to
execute their business plans.
Income Taxes
Dell's effective tax rate was 29.0% in fiscal 2004 compared to 29.9% for fiscal 2003 and 28.0% for fiscal 2002. Differences between Dell's effective tax rate
and the U.S. federal statutory rate of 35% principally result from Dell's geographical distribution of taxable income and losses and differences between book
and tax treatment of certain items. Dell's effective tax rate may decline in future periods as the company's business outside the U.S. continues to expand and
contribute an increasing portion of Dell's consolidated operating profits.
20