Dell 2003 Annual Report Download - page 52
Download and view the complete annual report
Please find page 52 of the 2003 Dell annual report below. You can navigate through the pages in the report by either clicking on the pages listed below, or by using the keyword search tool below to find specific information within the annual report.-
 1
1 -
2
-
3
-
4
-
5
-
6
-
7
-
8
-
9
-
10
-
11
-
12
-
13
-
14
-
15
-
16
-
17
-
18
-
19
-
20
-
21
-
22
-
23
-
24
-
25
-
26
-
27
-
28
-
29
-
30
-
31
-
32
-
33
-
34
-
35
-
36
-
37
-
38
-
39
-
40
-
41
-
 42
42 -
 43
43 -
 44
44 -
 45
45 -
 46
46 -
 47
47 -
 48
48 -
 49
49 -
 50
50 -
 51
51 -
 52
52 -
 53
53 -
 54
54 -
 55
55 -
 56
56 -
 57
57 -
 58
58 -
 59
59 -
 60
60 -
 61
61 -
 62
62 -
63
-
64
-
65
-
66
-
67
-
68
-
69
-
70
-
71
-
72
-
73
-
74
-
75
-
76
-
77
-
78
-
79
-
80
-
81
-
82
-
83
-
84
-
85
-
86
-
87
-
88
-
89
-
90
-
91
-
92
-
93
-
94
-
95
-
96
-
97
-
98
-
99
-
100
-
101
-
102
-
103
-
104
-
105
-
106
-
107
-
108
-
109
-
110
-
111
-
112
-
113
-
114
-
115
-
116
-
117
-
118
-
119
-
120
-
121
-
122
-
123
-
124
-
125
-
126
-
127
-
128
-
129
-
130
-
131
-
132
-
133
-
134
-
135
-
136
-
137
-
138
-
139
-
140
-
141
-
142
-
143
-
144
-
145
-
146
-
147
-
148
-
149
-
150
-
151
-
152
-
153
-
154
-
155
-
156
-
157
-
158
-
159
-
160
-
161
-
162
-
163
-
164
-
165
-
166
-
167
-
168
-
169
-
170
-
171
-
172
-
173
-
174
 |
 |
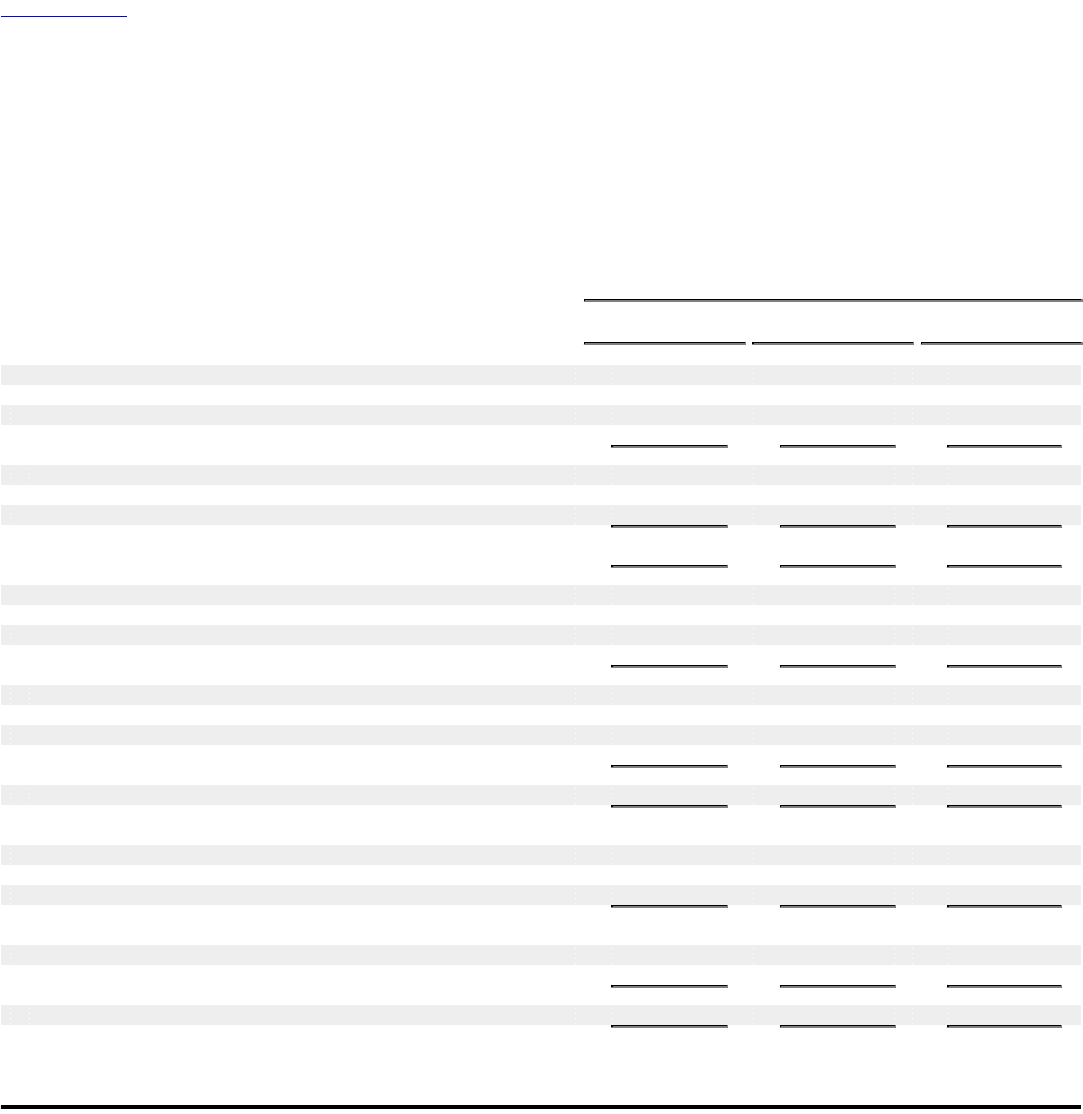
Table of Contents
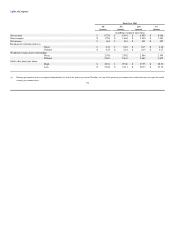
into Business and U.S. Consumer. The Americas Business segment includes sales to corporate, government, healthcare and education customers while the
U.S. Consumer segment includes sales primarily to individual consumers. The European region, which is based in Bracknell, England, covers Europe, the
Middle East, and Africa. The Asia Pacific-Japan region covers the Pacific Rim, including Australia and New Zealand, and is based in Singapore.
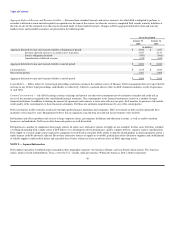
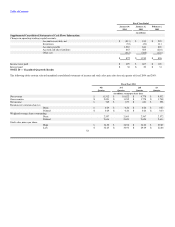
The accounting policies of Dell's reportable segments are the same as those described in the summary of significant accounting policies. Dell allocates
resources to and evaluates the performance of its segments based on operating income. Corporate expenses are included and special charges are excluded
from Dell's measure of segment operating income for management reporting purposes. The asset totals disclosed by geography are directly managed by those
regions and include accounts receivable, inventory, certain fixed assets, and certain other assets. Assets are not allocated specifically to the Business and
U.S. Consumer segments within the Americas. Corporate assets primarily include cash and cash equivalents, investments, deferred tax assets, and other assets.
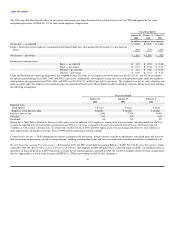
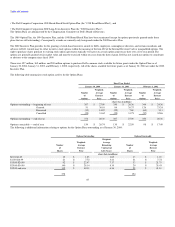
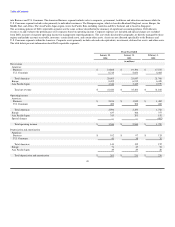
The table below presents information about Dell's reportable segments:
Fiscal Year Ended
January 30, January 31, February 1,
2004 2003 2002
(in millions)
Net revenue
Americas:
Business $ 21,888 $ 19,394 $ 17,275
U.S. Consumer 6,715 5,653 4,485
Total Americas 28,603 25,047 21,760
Europe 8,495 6,912 6,429
Asia Pacific-Japan 4,346 3,445 2,979
Total net revenue $ 41,444 $ 35,404 $ 31,168
Operating income
Americas:
Business $ 2,194 $ 1,945 $ 1,482
U.S. Consumer 400 308 260
Total Americas 2,594 2,253 1,742
Europe 637 388 377
Asia Pacific-Japan 313 203 152
Special charges — — (482)
Total operating income $ 3,544 $ 2,844 $ 1,789
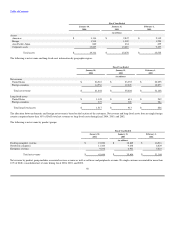
Depreciation and amortization
Americas:
Business $ 102 $ 97 $ 125
U.S. Consumer 41 38 32
Total Americas 143 135 157
Europe 71 47 54
Asia Pacific-Japan 49 29 28
Total depreciation and amortization $ 263 $ 211 $ 239
49