Dell 2003 Annual Report Download - page 53
Download and view the complete annual report
Please find page 53 of the 2003 Dell annual report below. You can navigate through the pages in the report by either clicking on the pages listed below, or by using the keyword search tool below to find specific information within the annual report.-
 1
1 -
2
-
3
-
4
-
5
-
6
-
7
-
8
-
9
-
10
-
11
-
12
-
13
-
14
-
15
-
16
-
17
-
18
-
19
-
20
-
21
-
22
-
23
-
24
-
25
-
26
-
27
-
28
-
29
-
30
-
31
-
32
-
33
-
34
-
35
-
36
-
37
-
38
-
39
-
40
-
41
-
42
-
 43
43 -
 44
44 -
 45
45 -
 46
46 -
 47
47 -
 48
48 -
 49
49 -
 50
50 -
 51
51 -
 52
52 -
 53
53 -
 54
54 -
 55
55 -
 56
56 -
 57
57 -
 58
58 -
 59
59 -
 60
60 -
 61
61 -
 62
62 -
 63
63 -
64
-
65
-
66
-
67
-
68
-
69
-
70
-
71
-
72
-
73
-
74
-
75
-
76
-
77
-
78
-
79
-
80
-
81
-
82
-
83
-
84
-
85
-
86
-
87
-
88
-
89
-
90
-
91
-
92
-
93
-
94
-
95
-
96
-
97
-
98
-
99
-
100
-
101
-
102
-
103
-
104
-
105
-
106
-
107
-
108
-
109
-
110
-
111
-
112
-
113
-
114
-
115
-
116
-
117
-
118
-
119
-
120
-
121
-
122
-
123
-
124
-
125
-
126
-
127
-
128
-
129
-
130
-
131
-
132
-
133
-
134
-
135
-
136
-
137
-
138
-
139
-
140
-
141
-
142
-
143
-
144
-
145
-
146
-
147
-
148
-
149
-
150
-
151
-
152
-
153
-
154
-
155
-
156
-
157
-
158
-
159
-
160
-
161
-
162
-
163
-
164
-
165
-
166
-
167
-
168
-
169
-
170
-
171
-
172
-
173
-
174
 |
 |

Table of Contents
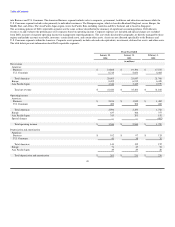
Fiscal Year Ended
January 30, January 31, February 1,
2004 2003 2002
(in millions)
Assets
Americas $ 3,134 $ 2,847 $ 2,319
Europe 1,510 1,302 1,220
Asia Pacific-Japan 860 634 499
Corporate assets 13,807 10,687 9,497
Total assets $ 19,311 $ 15,470 $ 13,535
The following is net revenue and long-lived asset information by geographic region:
Fiscal Year Ended
January 30, January 31, February 1,
2004 2003 2002
(in millions)
Net revenue
United States $ 26,510 $ 23,355 $ 20,295
Foreign countries 14,934 12,049 10,873
Total net revenue $ 41,444 $ 35,404 $ 31,168
Long-lived assets
United States $ 1,145 $ 613 $ 542
Foreign countries 372 300 284
Total long-lived assets $ 1,517 $ 913 $ 826
The allocation between domestic and foreign net revenue is based on the location of the customers. Net revenue and long-lived assets from no single foreign
country comprised more than 10% of Dell's total net revenues or long-lived assets during fiscal 2004, 2003, and 2002.
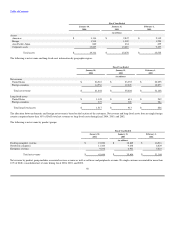
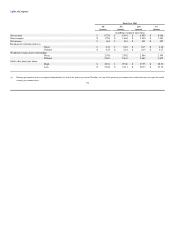
The following is net revenue by product groups:
Fiscal Year Ended
January 30, January 31, February 1,
2004 2003 2002
(in millions)
Desktop computer systems $ 21,026 $ 18,865 $ 16,516
Notebook computers 11,380 9,638 8,829
Enterprise systems 9,038 6,901 5,823
Total net revenue $ 41,444 $ 35,404 $ 31,168
Net revenue by product group includes associated services revenue as well as software and peripherals revenue. No single customer accounted for more than
10% of Dell's consolidated net revenue during fiscal 2004, 2003, and 2002.
50