Dell 2003 Annual Report Download - page 25
Download and view the complete annual report
Please find page 25 of the 2003 Dell annual report below. You can navigate through the pages in the report by either clicking on the pages listed below, or by using the keyword search tool below to find specific information within the annual report.-
 1
1 -
2
-
3
-
4
-
5
-
6
-
7
-
8
-
9
-
10
-
11
-
12
-
13
-
14
-
 15
15 -
 16
16 -
 17
17 -
 18
18 -
 19
19 -
 20
20 -
 21
21 -
 22
22 -
 23
23 -
 24
24 -
 25
25 -
 26
26 -
 27
27 -
 28
28 -
 29
29 -
 30
30 -
 31
31 -
 32
32 -
 33
33 -
 34
34 -
 35
35 -
36
-
37
-
38
-
39
-
40
-
41
-
42
-
43
-
44
-
45
-
46
-
47
-
48
-
49
-
50
-
51
-
52
-
53
-
54
-
55
-
56
-
57
-
58
-
59
-
60
-
61
-
62
-
63
-
64
-
65
-
66
-
67
-
68
-
69
-
70
-
71
-
72
-
73
-
74
-
75
-
76
-
77
-
78
-
79
-
80
-
81
-
82
-
83
-
84
-
85
-
86
-
87
-
88
-
89
-
90
-
91
-
92
-
93
-
94
-
95
-
96
-
97
-
98
-
99
-
100
-
101
-
102
-
103
-
104
-
105
-
106
-
107
-
108
-
109
-
110
-
111
-
112
-
113
-
114
-
115
-
116
-
117
-
118
-
119
-
120
-
121
-
122
-
123
-
124
-
125
-
126
-
127
-
128
-
129
-
130
-
131
-
132
-
133
-
134
-
135
-
136
-
137
-
138
-
139
-
140
-
141
-
142
-
143
-
144
-
145
-
146
-
147
-
148
-
149
-
150
-
151
-
152
-
153
-
154
-
155
-
156
-
157
-
158
-
159
-
160
-
161
-
162
-
163
-
164
-
165
-
166
-
167
-
168
-
169
-
170
-
171
-
172
-
173
-
174
 |
 |
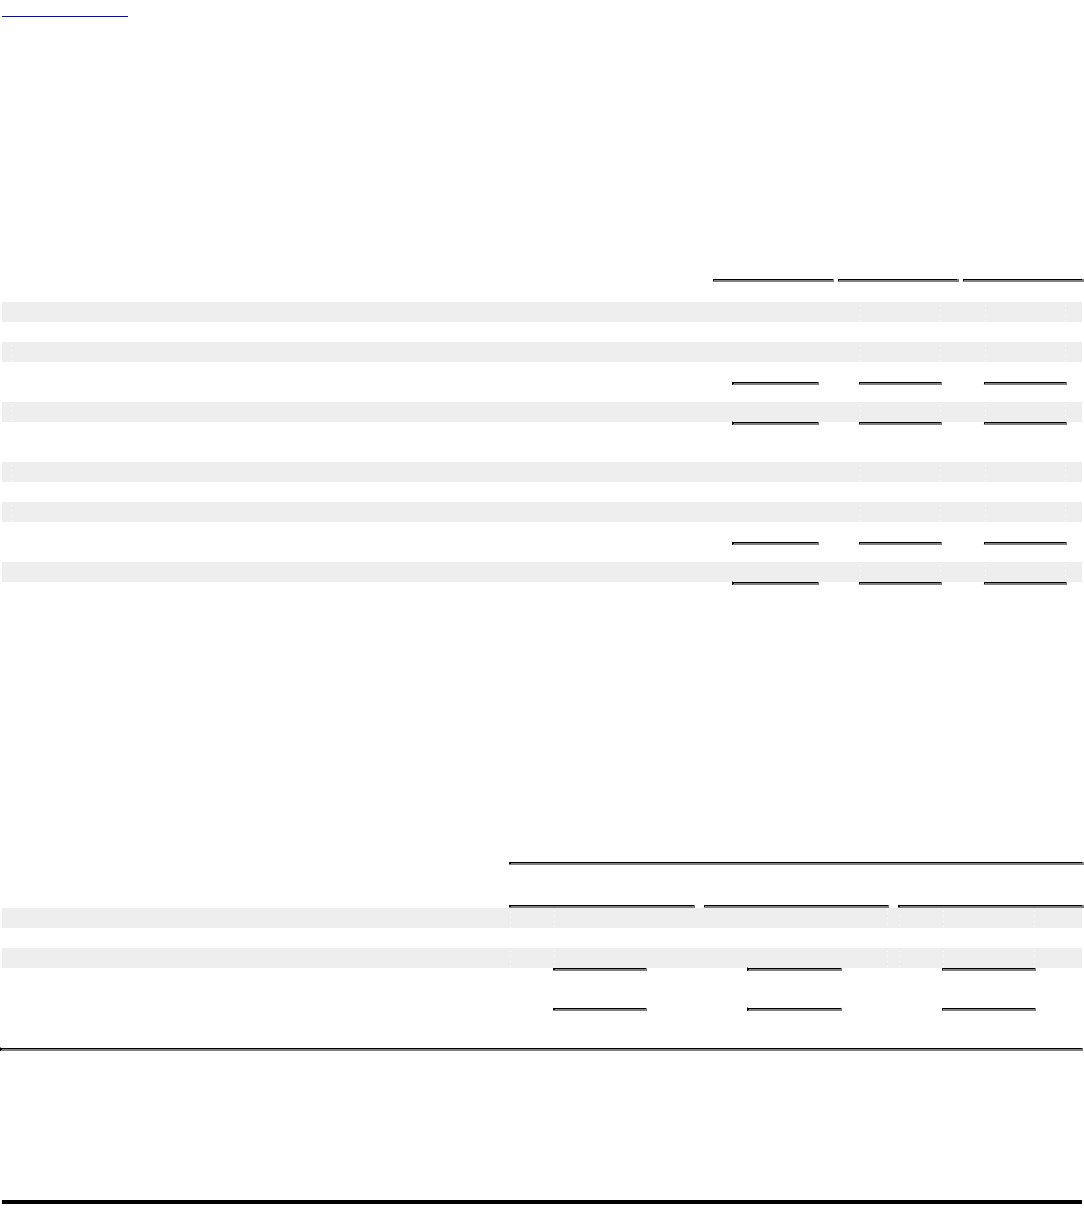
Table of Contents
Liquidity, Capital Commitments, and Contractual Cash Obligations
Liquidity
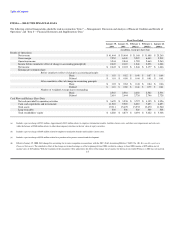
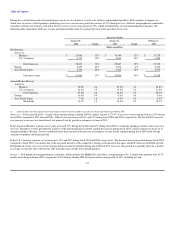
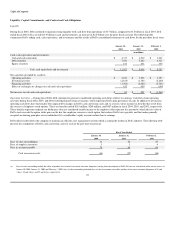
During fiscal 2004, Dell continued to maintain strong liquidity with cash flow from operations of $3.7 billion, compared to $3.5 billion in fiscal 2003. Dell
ended fiscal 2004 with a record $11.9 billion in cash and investments, an increase of $2.0 billion over the prior fiscal year end. The following table
summarizes Dell's ending cash, cash equivalents, and investments and the results of Dell's consolidated statements of cash flows for the past three fiscal years:
January 30, January 31, February 1,
2004 2003 2002
(in millions)
Cash, cash equivalents and investments:
Cash and cash equivalents $ 4,317 $ 4,232 $ 3,641
Debt securities 7,454 5,442 4,311
Equity securities 151 231 335
Cash, cash equivalents and investments $ 11,922 $ 9,905 $ 8,287
Net cash flow provided by (used in):
Operating activities $ 3,670 $ 3,538 $ 3,797
Investing activities (2,814) (1,381) (2,260)
Financing activities (1,383) (2,025) (2,702)
Effect of exchange rate changes on cash and cash equivalents 612 459 (104)
Net increase in cash and cash equivalents $ 85 $ 591 $ (1,269)
Operating Activities — During fiscal 2004, Dell continued to generate considerable operating cash flows relative to earnings. Cash flows from operating
activities during fiscal 2004, 2003, and 2002 resulted primarily from net income, which represents Dell's principal source of cash. In addition to net income,
operating cash flows have historically been impacted by changes in Dell's cash conversion cycle and, to a lesser extent, income tax benefits that result from
the exercise of employee stock options. These tax benefits totaled $181 million, $260 million, and $487 million in fiscal 2004, 2003, and 2002, respectively.
These benefits represent corporate tax deductions (that are considered taxable income to the employee) that represent the amount by which the fair value of
Dell's stock exceeds the option strike price on the day the employee exercises a stock option, that reduces Dell's taxes payable, and that under generally
accepted accounting principles are recorded directly to stockholders' equity accounts rather than to earnings.
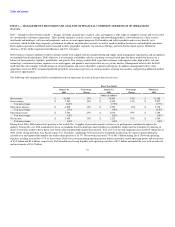
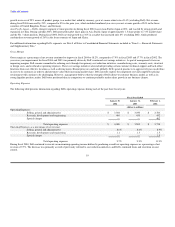
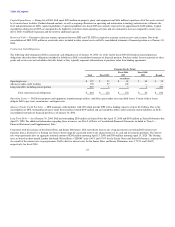
Dell's direct model allows the company to maintain an efficient asset management system which is among the leaders in Dell's industry. The following table
presents the components of Dell's cash conversion cycle for each of the past three fiscal years:
Fiscal Year Ended
January 30, January 31, February 1,
2004 2003 2002
Days of sales outstanding(a) 31 28 29
Days of supply in inventory 3 3 4
Days in accounts payable 70 68 69
Cash conversion cycle (36) (37) (36)
(a) Days of sales outstanding include the effect of product costs related to in-transit customer shipments (arising from the adoption of SAB 101) that are classified in other current assets. At
January 30, 2004, January 31, 2003 and February 1, 2002, days of sales outstanding included days of sales in accounts receivable and days of in-transit customer shipments of 28 and
3 days; 24 and 4 days; and 25 and 4 days, respectively. 22