Costco 2004 Annual Report Download - page 49
Download and view the complete annual report
Please find page 49 of the 2004 Costco annual report below. You can navigate through the pages in the report by either clicking on the pages listed below, or by using the keyword search tool below to find specific information within the annual report.-
 1
1 -
2
-
3
-
4
-
5
-
6
-
7
-
8
-
9
-
10
-
11
-
12
-
13
-
14
-
15
-
16
-
17
-
18
-
19
-
20
-
21
-
22
-
23
-
24
-
25
-
26
-
27
-
28
-
29
-
30
-
31
-
32
-
33
-
34
-
35
-
36
-
37
-
38
-
 39
39 -
 40
40 -
 41
41 -
 42
42 -
 43
43 -
 44
44 -
 45
45 -
 46
46 -
 47
47 -
 48
48 -
 49
49 -
 50
50 -
 51
51 -
 52
52 -
 53
53 -
 54
54 -
 55
55 -
 56
56
 |
 |

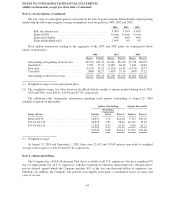
Note 9—Segment Reporting
The Company and its subsidiaries are principally engaged in the operation of membership warehouses in the
United States, Canada, Japan and the United Kingdom and through majority owned subsidiaries in Taiwan and
Korea and through a 50%-owned joint venture in Mexico. The Company’s reportable segments are based on
management responsibility and exclude the Mexico joint-venture, as it is accounted for under the equity method
and its operations are not consolidated in the Company’s financial statements.
United States
Operations
Canadian
Operations
Other
International
Operations Total
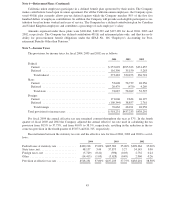
Year Ended August 29, 2004
Totalrevenue................................ $39,427,622 $6,042,804 $2,636,566 $48,106,992
Operating income ............................ 1,121,122 214,518 50,008 1,385,648
Depreciation and amortization .................. 364,432 40,220 36,069 440,721
Capital expenditures .......................... 560,387 89,748 55,485 705,620
Long lived assets ............................. 5,853,103 675,871 734,723 7,263,697
Total assets ................................. 12,107,613 1,717,962 1,266,973 15,092,548
Net assets ................................... 5,888,495 928,937 807,378 7,624,810
Year Ended August 31, 2003
Totalrevenue................................ $35,119,039 $5,237,023 $2,189,490 $42,545,552
Operating income ............................ 927,590 199,043 29,995 1,156,628
Depreciation and amortization .................. 323,850 33,732 33,720 391,302
Capital expenditures .......................... 698,713 68,432 43,520 810,665
Long lived assets ............................. 5,705,675 612,647 641,686 6,960,008
Total assets ................................. 10,522,260 1,579,972 1,089,456 13,191,688
Net assets ................................... 5,141,056 783,521 630,403 6,554,980
Year Ended September 1, 2002
Totalrevenue................................ $32,310,812 $4,750,173 $1,701,514 $38,762,499
Operating income ............................ 924,330 192,161 15,044 1,131,535
Depreciation and amortization .................. 281,812 33,477 26,492 341,781
Capital expenditures .......................... 868,069 35,098 135,438 1,038,605
Long lived assets ............................. 5,387,772 514,854 620,993 6,523,619
Total assets ................................. 9,418,500 1,198,992 1,002,771 11,620,263
Net assets ................................... 4,485,487 617,731 591,019 5,694,237
The accounting policies of the segments are the same as those described in Note 1. All inter-segment total
revenue and expenses are immaterial and have been eliminated in computing total revenue and operating income.
47