Costco 2004 Annual Report Download - page 38
Download and view the complete annual report
Please find page 38 of the 2004 Costco annual report below. You can navigate through the pages in the report by either clicking on the pages listed below, or by using the keyword search tool below to find specific information within the annual report.-
 1
1 -
2
-
3
-
4
-
5
-
6
-
7
-
8
-
9
-
10
-
11
-
12
-
13
-
14
-
15
-
16
-
17
-
18
-
19
-
20
-
21
-
22
-
23
-
24
-
25
-
26
-
27
-
 28
28 -
 29
29 -
 30
30 -
 31
31 -
 32
32 -
 33
33 -
 34
34 -
 35
35 -
 36
36 -
 37
37 -
 38
38 -
 39
39 -
 40
40 -
 41
41 -
 42
42 -
 43
43 -
 44
44 -
 45
45 -
 46
46 -
 47
47 -
 48
48 -
49
-
50
-
51
-
52
-
53
-
54
-
55
-
56
 |
 |

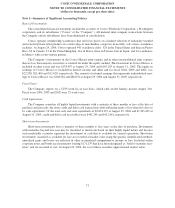
NOTES TO CONSOLIDATED FINANCIAL STATEMENTS
(dollars in thousands, except per share data) (Continued)
Note 1—Summary of Significant Accounting Policies (Continued)
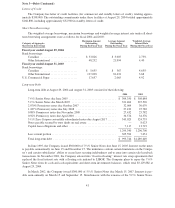
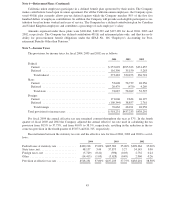
Had compensation costs for the Company’s stock-based compensation plans been determined based on the
fair value at the grant dates for awards made prior to fiscal 2003, under those plans and consistent with SFAS No.
123, the Company’s net income and net income per share would have been reduced to the pro forma amounts
indicated below:
Fiscal Year Ended
August 29,
2004
August 31,
2003
September
1, 2002
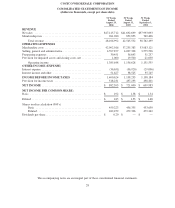
Net income, as reported ........................................... $882,393 $721,000 $699,983
Add: Stock-based employee compensation expense included in reported
net income, net of related tax effects ........................... 23,000 7,513 —
Deduct: Total stock-based employee compensation expense determined
under fair value based methods for all awards, net of related tax
effects ................................................... (58,388) (70,257) (75,743)
Pro-formanetincome............................................. $847,005 $658,256 $624,240
Net Income per share:
Basic—as reported ........................................... $ 1.92 $ 1.58 $ 1.54
Basic—pro-forma ............................................ $ 1.84 $ 1.44 $ 1.38
Diluted—as reported ......................................... $ 1.85 $ 1.53 $ 1.48
Diluted—pro-forma .......................................... $ 1.78 $ 1.40 $ 1.32
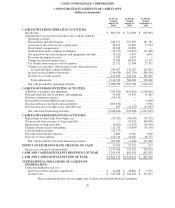
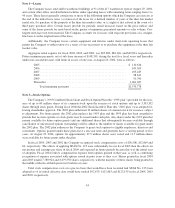
Fair Value of Financial Instruments
The carrying value of the Company’s financial instruments, including cash and cash equivalents, receivables
and accounts payable approximate fair value due to their short-term nature or variable interest rates. Short-term
investments classified as available for sale are recorded at market value with unrealized gains or losses reflected
in other accumulated comprehensive income or loss. Short-term investments designated as “hold-to-maturity”
securities are recorded at cost and approximated market value at August 29, 2004. The fair value of fixed rate
debt at August 29, 2004 and August 31, 2003 was $1,581,368 and $1,415,252, respectively.
Closing Costs
Warehouse closing costs incurred relate principally to the Company’s efforts to relocate certain warehouses
that were not otherwise impaired to larger and better-located facilities. The provision for fiscal 2004 included
charges of $16,548 for warehouse closing expenses offset by net gains of $15,548 related to the sale of real prop-
erty. The fiscal 2003 provision included charges of $11,836 for warehouse closing expenses and $2,967 for net
losses on the sale of real property. As of August 29, 2004, the Company’s reserve for warehouse closing costs
was $10,367, of which $9,184 related to future lease obligations. This compares to a reserve for warehouse clos-
ing costs of $8,609 at August 31, 2003, of which $7,833 related to future lease obligations.
36