Costco 2004 Annual Report Download - page 15
Download and view the complete annual report
Please find page 15 of the 2004 Costco annual report below. You can navigate through the pages in the report by either clicking on the pages listed below, or by using the keyword search tool below to find specific information within the annual report.-
 1
1 -
2
-
3
-
4
-
 5
5 -
 6
6 -
 7
7 -
 8
8 -
 9
9 -
 10
10 -
 11
11 -
 12
12 -
 13
13 -
 14
14 -
 15
15 -
 16
16 -
 17
17 -
 18
18 -
 19
19 -
 20
20 -
 21
21 -
 22
22 -
 23
23 -
 24
24 -
 25
25 -
26
-
27
-
28
-
29
-
30
-
31
-
32
-
33
-
34
-
35
-
36
-
37
-
38
-
39
-
40
-
41
-
42
-
43
-
44
-
45
-
46
-
47
-
48
-
49
-
50
-
51
-
52
-
53
-
54
-
55
-
56
 |
 |

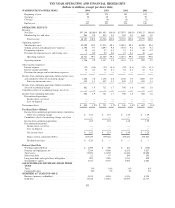
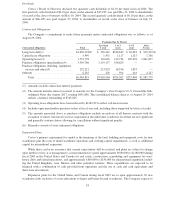
SELECTED CONSOLIDATED STATEMENTS OF INCOME DATA
The table below presents selected operational data, the percentage relationship between net sales and
major categories in the Consolidated Statements of Income and the percentage change in the dollar amounts
of each of the items.
Percent of Net Sales
Percentage Increase/(Decrease)
(of dollar amounts)
Fiscal 2004 Fiscal 2003 Fiscal 2002
Fiscal 2004
vs. Fiscal 2003
Fiscal 2003
vs. Fiscal 2002
Net sales ............................... 100.00% 100.00% 100.00% 13.1% 9.7%
Membership fees ........................ 2.04 2.05 2.03 12.7 10.8
Grossmargin(a) ........................ 10.72 10.69 10.55 13.4 11.2
Selling, general and administrative .......... 9.75 9.83 9.41 12.2 14.6
Preopeningexpenses ..................... 0.07 0.09 0.13 (16.9) (28.5)
Provision for impaired assets and closing costs,
net ................................. — 0.05 0.06 (94.9) (7.4)
Operating income .................... 2.94 2.77 2.98 19.8 2.2
Interest expense ......................... (0.08) (0.08) (0.08) (0.7) 26.9
Interest income and other ................. 0.11 0.09 0.09 34.0 7.8
Incomebeforeincometaxes ........... 2.97 2.78 2.99 20.9 1.8
Provision for income taxes ............ 1.10 1.05 1.15 18.5 (0.2)
NetIncome..................... 1.87% 1.73% 1.84% 22.4% 3.0%
(a) Defined as net sales less merchandise costs.
Comparison of Fiscal 2004 (52 weeks) and Fiscal 2003 (52 weeks):
(dollars in thousands, except earnings per share)
Net Income
Net income for fiscal 2004 increased 22.4% to $882,393, or $1.85 per diluted share, from $721,000, or
$1.53 per diluted share during fiscal year 2003.
Net Sales
Net sales increased 13.1% to $47,145,712 in fiscal 2004 from $41,692,699 in fiscal 2003. Approximately
78% of the increase was due to an increase in comparable warehouse sales, that is sales in warehouses open for at
least a year. The balance of the increase was due to opening 20 new warehouses during fiscal 2004 and a net of
23 new warehouses (29 opened, 6 closed) during fiscal 2003, a portion of which is not included in comparable
warehouse sales. Net sales were reduced by the implementation of Emerging Issues Task Force (EITF) Issue No.
03-10, “Application of Issue No. 02-16, “Accounting by a Customer (Including a Reseller) for Certain Consid-
eration Received from a Vendor,” by Resellers to Sales Incentives Offered to Consumers by Manufacturers,”
which was effective at the beginning of the Company’s fiscal 2004 third quarter. EITF 03-10, which primarily
impacts the Company’s vendor coupon programs, reduces net sales and merchandise costs by an equal amount
and does not affect the Company’s consolidated gross margin or net income. Had EITF 03-10 been in effect for
the comparable periods in fiscal 2003, the net sales increase in fiscal 2004 would have been 13.8%. (See Re-
cently Issued Accounting Pronouncements, EITF 03-10.)
For fiscal 2004, comparable sales increased 10% from fiscal 2003. Had EITF 03-10 been in effect for the
comparable periods in fiscal 2003, the comparable sales increase for fiscal 2004 would have been 11%.
13